Assessment of anthropometric parameters and clinical profile as predictors for Obstructive Sleep Apnoea severity in a tertiary care hospital in South India
Jayavignesh1*, G Dominic Rodriguez2
1DNB-General Medicine, Kauvery Hospital, Tennur, Trichy
2Consultant General Physician, Kauvery Hospital, Tennur, Trichy
Abstract
Background: Obstructive sleep apnoea (OSA) syndrome is a chronic disease characterized by episodes of upper airway collapse, and has been associated with increased cardiovascular morbidity. Although clinical and epidemiological studies have shown that OSA and obesity are strongly associated, few Indian studies have examined the associations of anthropometric indices and OSA.
Aim: The aim of this study was to correlate anthropometric parameters of patients with OSA with the severity of OSA and to estimate the association of the pre-existing comorbidities with the severity of OSA
Patients and methods: Patients who had been diagnosed to have OSA by Level 1 PSG, were divided into 3 categories based on severity of OSA by using AHI (Apnoea Hypopnoea Index) Mild OSA (5 ≤ AHI < 15), Moderate OSA (15 ≤ AHI < 30) and Severe OSA (AHI ≥ 30) . Anthropometric parameters and clinical profile of these three groups were collected and compared.
Results: Neck Circumference (p-value 0.000), Body Mass Index (p-value 0.005), Waist Circumference (p-value 0.000), Waist Hip Ratio (p-value 0.001) and Waist Height Ratio (p- value 0.001) and Mallampatti score (p- value 0.008) showed significant positive correlation with severity of OSA. In our limited population study, the cutoff values for predicting mild, moderate and severe OSA were determined as as ≤39cm,≤40cm and >40cm for neck circumference respectively ,as for BMI ≤25.14 kg/m2, ≤29.86 kg/m2 and >28.76 kg/m2 respectively and as for waist hip ratio(WHR) ≤0.95 , ≤0.97 and >0.95 respectively.
Conclusion: Clinical assessment of patients with history and accurate anthropometric measurements is very useful in predicting the severity of OSA and can be used in motivating individuals to undergo confirmative assessment, thereby help in providing effective therapy based on severity preventing subsequent morbidity and mortality.
Abbreviations
OSA-Obstructive Sleep Apnoea
OSAS-Obstructive Sleep Apnoea Syndrome
PSG-Polysomnography
AHI-Apnoea Hypopnoea Index
AASM-American Academy of Sleep Medicine
NREM-Non Rapid Eye Movement
REM-Rapid Eye Movement
RDI-Respiratory Disturbance Index
BMI-Body Mass Index
NC-Neck Circumference
HC-Hip Circumference
WC/AC-Waist Circumference /Abdominal Circumference
WHR-Waist Circumference to Hip Circumference Ratio
WHtR- Waist Circumference to Height Circumference Ratio
NWR- Neck Circumference to Waist Circumference Ratio
DM-Diabetes Mellitus
CAD-Coronary Artery Disease
COPD-Chronic Obstructive Pulmonary Disease
cm-centimetre
kg-kilogram
kg/m2-kilogram/metre2
AUC-Area Under Circumference
Background
Obstructive sleep apnoea (OSA) is a sleep-related breathing disorder that involves a decrease or complete halt in airflow despite an ongoing effort to breathe. It occurs when the muscles relax during sleep, causing soft tissue in the back of the throat to collapse and block the upper airway. This leads to partial reductions (hypopnoeas) and complete pauses (apnoeas) in breathing that last at least 10 seconds during sleep. Most pauses last between 10 and 30 seconds, but some may persist for one minute or longer. This can lead to abrupt reductions in blood oxygen saturation, with oxygen levels falling as much as 40 percent or more in severe cases. The brain responds to the lack of oxygen by alerting the body, causing a brief arousal from sleep that restores normal breathing. This pattern can occur hundreds of times in one night. The result is a fragmented quality of sleep that often produces an excessive level of daytime sleepiness. Most people with OSA snore loudly and frequently, with periods of silence when airflow is reduced or blocked. They then make choking, snorting or gasping sounds when their airway reopens.
A common measurement of sleep apnoea is the apnoea-hypopnoea index (AHI). This is an average that represents the combined number of apnoeas and hypopnoeas that occur per hour of sleep1.
When OSA, defined by polysomnography, is associated with daytime symptoms such as excessive daytime sleepiness, OSA syndrome (OSAS) is present.
In India, the prevalence of OSA and OSAS was found to be 9.3% and 2.8% respectively². In one of the largest studies ever done with level I PSG, OSA was found to be highly prevalent (32.5%). This prevalence was much higher than seen in previous studies3.
OSA is commonly associated with snoring and excessive daytime sleepiness. Snoring is the most common nocturnal symptoms that could be loud and disturbing to the bed partner’s sleep. Bed partners may report also cessation of breathing (witnessed apnoea) which ends by snorting sound or gasping for air. Other nocturnal symptoms are unexplained awakenings, nocturia, and restless sleep.
During the day, patient commonly complain of excessive sleepiness despite long hours of night sleep. This may correlate with the severity of the OSA when there is no other precipitating factor to cause hypersomnia. Some patients will also complain of morning headache, not refreshed from sleep, memory problems, and difficulty concentrating.
OSA should be suspected clinically by presenting history, physical findings and then confirmed by specific sleep tests. The severity of OSA can range from mild snoring to hypopnoea and sleep apnoea. The anatomic factors that promote pharyngeal narrowing include large neck circumference, soft tissue, bone, or vessels. Many of these structures can lead to increased pressure surrounding the upper airway, resulting in pharyngeal collapsibility and insufficient space to accommodate airflow to a portion of the upper airway during sleep.
In addition, the upper airway muscle tone plays a role; when this muscle decreases, a repetitive total or partial airway collapse results.
The most common cause of OSA in adults is obesity, male sex, and advancing age. The severity of OSA decreases with age when adjusting for body mass index.
| Anatomic Factors | Nonanatomic Risk Factors |
|---|---|
| Micrognathia, retrognathia | Central fat distribution |
| Facial elongation | Obesity |
| Mandibular hypoplasia | Advanced age |
| Adenoid hypertrophy | Male gender |
| Tonsillar hypertrophy | Pregnancy |
Additional Factors
- Alcohol use
- Smoking
- Use of sedatives and hypnotics
Associated Medical Disorders
- Endocrine disorders (eg, diabetes mellitus, metabolic syndrome, acromegaly, and hypothyroidism)
- Neurological disorders (eg, stroke, spinal cord injury, and myasthenia gravis)
- Prader Willi syndrome
- Down Syndrome
- Congestive heart failure
- Atrial fibrillation
- Obesity hypoventilation syndrome
These relationships between OSA and various medical disorders are based mainly on observational studies and not necessarily randomized clinical trials5.
Introduction
The hypothesis of a correlation between anthropometric measurements and OSA severity was the basis of the present study that aimed to investigate this correlation and demonstrate probable positive predictive anthropometric indices and their cutoff values for suspecting the OSA severity.
Objectives of our study
- To correlate anthropometric parameters of patients with OSA with the severity of OSA
- To estimate the association of the pre-existing comorbidities of the patients with the severity of OSA
Rationale/Need for the study
Although polysomnography (PSG) is an essential gold standard tool for the diagnosis of OSA, it is costly, complex, is not readily available, especially in underdeveloped countries, requires expert technical service, and in many countries it is difficult to access.
For better prediction of OSA, radiographic modalities including MRI, computed tomography, and ultrasonography (US) have been applied to assess the upper airway anatomy in OSA patients. However, MRI and computed tomography cannot be widely applied due to the high costs and radiation exposure.
Therefore, a simpler and less costly method is needed as a screening method to detect and pick up patients who are at a high risk for OSA when considering the use of full overnight PSG to confirm the diagnosis of OSA. However, no studies suggest anthropometric measurements except for NC as a risk factor for OSA.
Aims and objectives
Aim
- To correlate anthropometric parameters of patients with OSA with the severity of OSA
- To estimate the association of the pre-existing comorbities of the patients with the severity of OSA
Objectives
- To measure anthropometric parameters of patients with OSA
- To correlate anthropometric parameters of the patients with the severity of OSA
- To enlist the pre-existing comorbidities of the patients with OSA
- To estimate the association of the pre-existing comorbidities of the patients with the severity of OSA
Materials and Methods
Study area
Kauvery Medical Centre and Hospital NO 1 KC road Tennur, Trichy
Study setting
Analysis of anthropometric parameters and clinical profile of the patients diagnosed to have OSA by level 1 PSG study in kauvery medical centre
Duration of study
1 year
Study design
Retrospective observational study
Study population
Patients diagnosed to have OSA in kauvery medical centre and hospital, Tennur, Trichy.
Inclusion criteria
Patients above 18 years of age already diagnosed to have OSA by LEVEL-1 PSG
Exclusion criteria
Patients below 18 years of age
Patients with recent MI
Pregnant women
Data collection and methodology
Patients who had been diagnosed to have OSA by Level 1 overnight polysomnography which was analyzed by a single professional, who specialized in sleep disorders, were divided into 3 categories based on severity of OSA by using AHI (Apnoea Hypopnoea Index),
- Mild OSA (5 ≤ AHI < 15),
- Moderate OSA (15 ≤ AHI < 30)
- Severe OSA (AHI ≥ 30).
Anthropometric parameters
Body weight of all participants was recorded in erect position without shoes and wearing only light indoor clothes, with a bathroom weighing scale. Height was measured to the nearest 1 cm and BMI was calculated as body weight/height2 (kg/m2 ). The circumferences were measured and assessed with the aid of nonelastic nonflexible measuring tape and recorded in centimeters. WC (AC) was measured (with patients in the standing position) midway between the lower rib cage margin and the anterior superior iliac spine. The reading was taken at the end of a normal exhalation. HC was measured with patients in the standing position at the maximum circumference of the buttocks (along a horizontal line at the femoral greater trochanter) with the participant standing with feet placed together. NC was measured along a horizontal line across the midline of the thyroid cartilage (at the level of the cricothyroid membrane). Waist–hip ratio (WHR) was calculated by dividing the waist circumference by the Hip circumference. Waist-height ratio (WHtR) was calculated by dividing the waist circumference by height. Neck to waist ratio (NWR) was calculated by dividing the neck circumference by waist circumference.
Patients with BMI ≥27.5% and <27.5% were considered as obese and non-obese35.
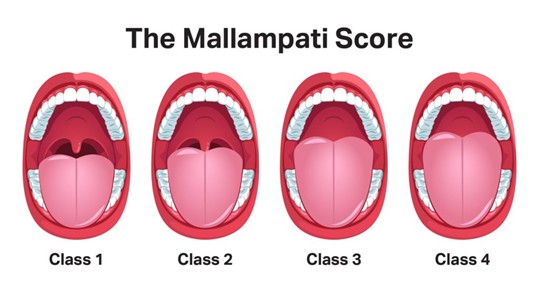
Mallampatti score39 was also obtained from the participants based on a 1 to 4 scale as depicted in the following image,
- The patient’s tonsils, uvula, and soft palate are completely visible.
- Hard and soft palate, upper tonsils, and uvula are visible.
- Hard and soft palate are visible, uvula is somewhat obscured.
- Only hard palate is visible.
Clinical profile
Full medical history of the participants along with their history of pre-existing co-morbidities and history of smoking and alcohol consumption were enquired and collected.
The data was compared among the OSA severity groups and with AHI obtained from overnight PSG and observed for association.
Statistical Methods
Equation
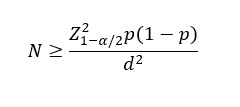
Where,
P is the Prevalence or Proportion of event of interest for the study,
Z_(1-α/2) ^2 normal deviate for two tailed alternative hypothesis at a level significances
n = Sample Size
N= Population Size
p = the estimated proportion of the population
d = desired absolute precision (or) absolute level of precision
| Sample Size for Frequency in a Population | |
|---|---|
| Alpha (α) | 0.05 |
| Estimated Proportion (p) | 50 |
| Estimation error (d) | 13 |
| Sample Size(n) | |
| Confidence Level (%) | Minimal Sample Size |
| 95% | 57 |
Sample size of the study is 58. In addition, 14 patients were enrolled during the last 6 weeks period in response to the suggested modifications. Modified sample size was 72.
Statistical Analysis
Statistical analysis was performed using SPSS, (Version 20.0). The continuous variables were expressed as Mean and Standard deviation. Categorical variables were be expressed as frequency and percentage. Independent ‘t’-test was used to find the significance difference between groups. Correlations relationship between two variables were analyzed by applying Pearson′s coefficient. Chi- square test and fisher’s exact test were used to find out association between the categorical variables. P<0.05 was considered as statistically significant.
Results
A total of 72 patients were included in the analysis
Table 1: Characteristics of The Sample Population Including Anthropometric Parameters and AHI
| Descriptive Statistics | ||||||
|---|---|---|---|---|---|---|
| Parameters | N | Range | Min | Max | Mean | Std. Dev |
| Age | 72 | 62 | 20 | 82 | 55.61 | 14.649 |
| Height(cm) | 72 | 39 | 148 | 187 | 163.39 | 10.078 |
| Weight(kg) | 72 | 84 | 51 | 135 | 85.13 | 16.960 |
| BMI(kg/m2) | 72 | 32 | 19 | 51 | 32.09 | 6.689 |
| Neck circumference(cm) | 72 | 25.30 | 30.50 | 55.80 | 40.38 | 4.33 |
| Waist circumference (cm) | 72 | 63.60 | 71.00 | 134.60 | 107.73 | 12.29 |
| Hip circumference (cm) | 72 | 59.00 | 76.00 | 135.00 | 110.63 | 11.84 |
| Waist to hip ratio | 72 | .38 | .78 | 1.16 | .98 | .07 |
| Waist to height ratio | 72 | .41 | .43 | .84 | .66 | .09 |
| Neck to waist ratio | 72 | .22 | .30 | .52 | .38 | .04 |
| AHI | 72 | 141.80 | 5.80 | 147.60 | 41.77 | 28.73 |
The mean age was 55.61±14.649 years (range, 20 to 82 years).
The mean height was 163.39±10.078 cm (range, 148 to 187 cm).
The mean weight was 85.13±16.96 kg (range, 51 to 135 kg).
The mean BMI was 32.09±6.689 kg/m2 (range, 19 to 51 kg/m2).
The mean neck circumference (NC) was 40.38±4.33 cm (range, 30.50 to 55.8 cm).
The mean waist circumference (WC) was 107.73±12.29 cm (range, 71 to 134.60 cm).
The mean hip circumference (HC) was 110.63±11.84 cm (range, 76 to 135 cm).
The mean waist to hip ratio (WHR) was 0.98±0.07 (range, 0.78 to 1.16).
The mean waist to height ratio (WHtR) was 0.66±0.09 (range, 0.43 to 0.84).
The mean neck to waist ratio (NWR) was 0.377±0.046 (range, 0.30 to 0.52).
The mean AHI was 41.77±28.73 (range, 5.80 to 147.60).
Table 2: Mean with Standard Deviation and p-value of Anthropometric Parameters and AHI of Sample Population with Mild, Moderate and Severe OSA
| Parameters. | Severity | N | Mean | Std. Dev | Sig |
|---|---|---|---|---|---|
| Age (years) | Mild | 10 | 47.70 | 18.715 | 0.179 |
| Moderate | 26 | 56.31 | 14.571 | ||
| Severe | 36 | 57.31 | 13.130 | ||
| Height(cm) | Mild | 10 | 161.50 | 9.229 | 0.819 |
| Moderate | 26 | 163.65 | 10.681 | ||
| Severe | 36 | 163.72 | 10.073 | ||
| Weight(kg) | Mild | 10 | 70.95 | 12.962 | 0.001 |
| Moderate | 26 | 81.58 | 13.811 | ||
| Severe | 36 | 91.64 | 17.137 | ||
| Bmi(kg/m2) | Mild | 10 | 27.69 | 7.348 | 0.008 |
| Moderate | 26 | 30.76 | 6.241 | ||
| Severe | 36 | 34.27 | 6.110 | ||
| Neck circumference(cm) | Mild | 10 | 37.6000 | 3.40588 | 0.007 |
| Moderate | 26 | 39.4077 | 4.72245 | ||
| Severe | 36 | 41.8528 | 3.74505 | ||
| Waist circumference (cm) | Mild | 10 | 98.5000 | 13.21825 | 0.003 |
| Moderate | 26 | 105.2846 | 10.55423 | ||
| Severe | 36 | 112.0583 | 11.56548 | ||
| Hip circumference (cm) | Mild | 10 | 105.2000 | 15.31738 | 0.291 |
| Moderate | 26 | 111.1154 | 12.17649 | ||
| Severe | 36 | 111.7972 | 10.40674 | ||
| Waist to hip ratio | Mild | 10 | .9380 | .01989 | 0.003 |
| Moderate | 26 | .9504 | .06258 | ||
| Severe | 36 | 1.0042 | .08122 | ||
| Waist to height ratio | Mild | 10 | .6130 | .09889 | 0.029 |
| Moderate | 26 | .6469 | .08284 | ||
| Severe | 36 | .6869 | .07924 | ||
| Neck to waist ratio | Mild | 10 | .3880 | .05266 | 0.793 |
| Moderate | 26 | .3762 | .04734 | ||
| Severe | 36 | .3761 | .04183 | ||
| AHI | Mild | 10 | 11.9400 | 2.96843 | .000 |
| Moderate | 26 | 23.0192 | 3.90907 | ||
| Severe | 36 | 63.6056 | 25.60549 |
Among the anthropometric parameters, weight, BMI, waist circumference, neck circumference, circumference, waist to hip ratio and waist to height ratio show statistical significance ( p value < 0.05 ) with OSA severity groups.
Table 3: Association of Gender with Severity of OSA
| Gender vs Status | |||||||||
|---|---|---|---|---|---|---|---|---|---|
| Gender | Status | Total | % | p Value | |||||
| Mild | % | Moderate | % | Severe | % | ||||
| Male | 6 | 60.00% | 12 | 46.20% | 28 | 77.80% | 46 | 63.90% | χ2= 0.037 SIG |
| Female | 4 | 40.00% | 14 | 53.80% | 8 | 22.20% | 26 | 36.10% | |
| Over All | 10 | 26 | 36 | 72 | |||||
Figure 1: Bar Chart Depicting Association of Gender with Severity of OSA

Among the study population, 46 ( 63.9% ) were males and 26, (36.1% ) were females.
In mild OSA group, 6 (60%) were males and 4 (40%) were females.
In moderate OSA group, 12 (46.2%) were males and 14 (53.8%) were females.
In severe OSA group, 28 (77.8%) were males and 8 (22.2%) were females.
There was statistically significant association between gender and severity of OSA
( p < 0.05 ).
Table 4: Association of BMI with Severity of OSA
| BMI * Status | |||||||||
|---|---|---|---|---|---|---|---|---|---|
| BMI | Status | Total | % | p Value | |||||
| Mild | % | Moderate | % | Severe | % | ||||
| ≥ 27.5 (Obese) | 4 | 40.0% | 18 | 69.2% | 32 | 88.9% | 54 | 75.0% | χ2= 0.005 SIG |
| <27.5 (Non-Obese) | 6 | 60.0% | 8 | 30.8% | 4 | 11.1% | 18 | 25.0% | |
| Over All | 10 | 26 | 36 | 72 | |||||
Figure 2: Bar Chart Depicting Association of BMI with Severity of OSA
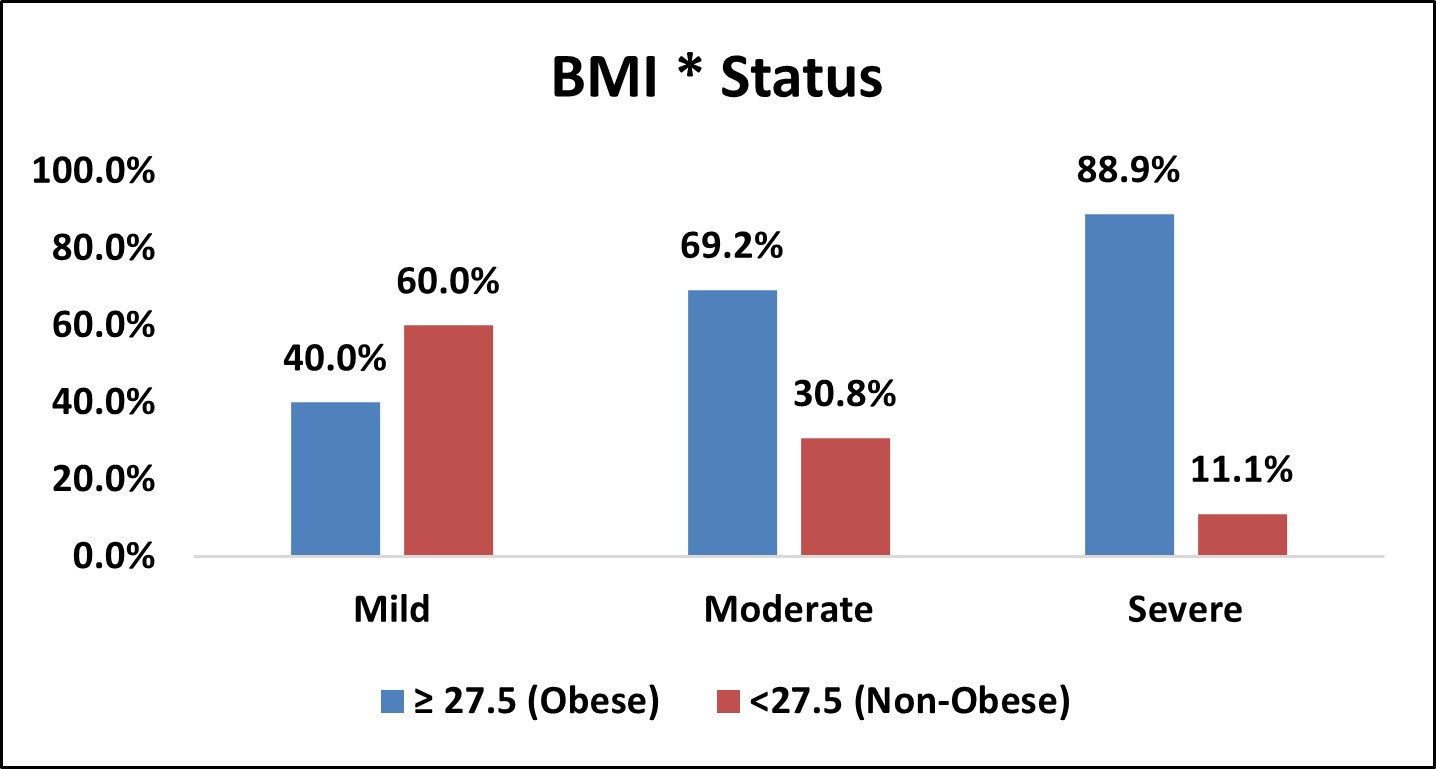
Among the study population, 54 ( 75% ) were obese and 18, (25% ) were non-obese.
In mild OSA group,4 (40%) were obese and 6 (60%) were non-obese.
In moderate OSA group,18 (69.2%) were obese and 8 (30.8%) were non-obese.
In severe OSA group,32 (88.9%) were obese and 4 (11.1%) were non-obese.
There was statistically significant association between BMI and severity of OSA
( p < 0.05 ).
Table 5: Association of Mallampatti Score with Severity of OSA
| Mallampatti Score vs Status | |||||||||
|---|---|---|---|---|---|---|---|---|---|
| Mallampatti Score | Status | Total | % | p Value | |||||
| Mild | % | Moderate | % | Severe | % | ||||
| Class 1 | 0 | 0 | 0 | 0 | 0 | 0 | 0 | 0 | χ2= 0.000 SIG |
| Class 2 | 7 | 70.0% | 2 | 7.7% | 4 | 11.1% | 13 | 18.1% | |
| Class 3 | 3 | 30.0% | 14 | 53.8% | 9 | 25.0% | 26 | 36.1% | |
| Class 4 | 0 | 0.0% | 10 | 38.5% | 23 | 63.9% | 33 | 45.8% | |
| Over All | 10 | 26 | 36 | 72 | |||||
Figure 3: Bar Chart Depicting Association of Mallampatti Score with Severity of OSA
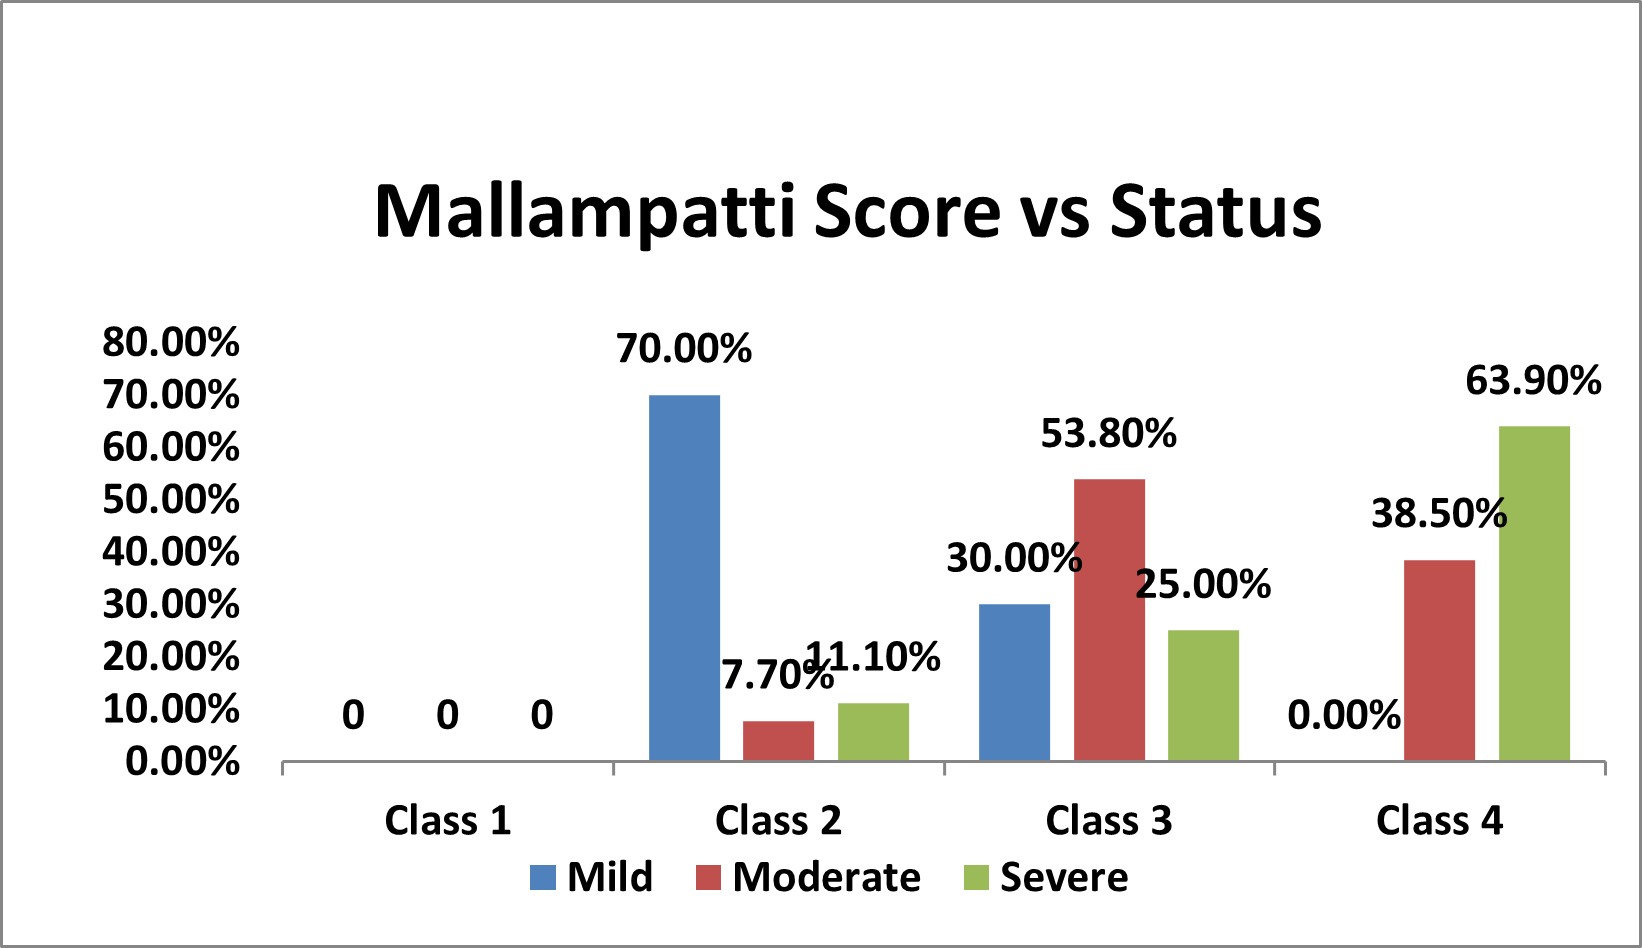
Among the study population,13 (18.1% ) had class 2 , 26 ( 36.1% ) has class 3 and 33 (45.8% ) had class 3 mallampatti score.
In mild OSA group, 7 (70%) had class 2 and 3 (30%) had class 3 mallampatti score.
Table 6: Association of Diabetes Mellitus with Severity of OSA
In moderate OSA group, 2 (7.70%) had class 2, 14 (53.8%) had class 3 and 10 (38.5%) had class 4 mallampatti score
In severe OSA group, 4 (11.1%) had class 2, 9 (25%) had class 3 and 23 (63.9%) had class 4 mallampatti score
There was statistically significant association between mallampatti score and severity of OSA ( p < 0.05 ).
Figure 4: Bar Chart Depicting Association of Diabetes Mellitus with Severity of OSA
| Diabetes Mellitus vs Status | |||||||||
|---|---|---|---|---|---|---|---|---|---|
| Diabetes Mellitus | Status | Total | % | p Value | |||||
| Mild | % | Moderate | % | Severe | % | ||||
| Yes | 3 | 30.0% | 8 | 30.8% | 19 | 52.8% | 30 | 41.7% | χ2= 0.161 NS |
| No | 7 | 70.0% | 18 | 69.2% | 17 | 47.2% | 42 | 58.3% | |
| Over All | 10 | 26 | 36 | 72 | |||||
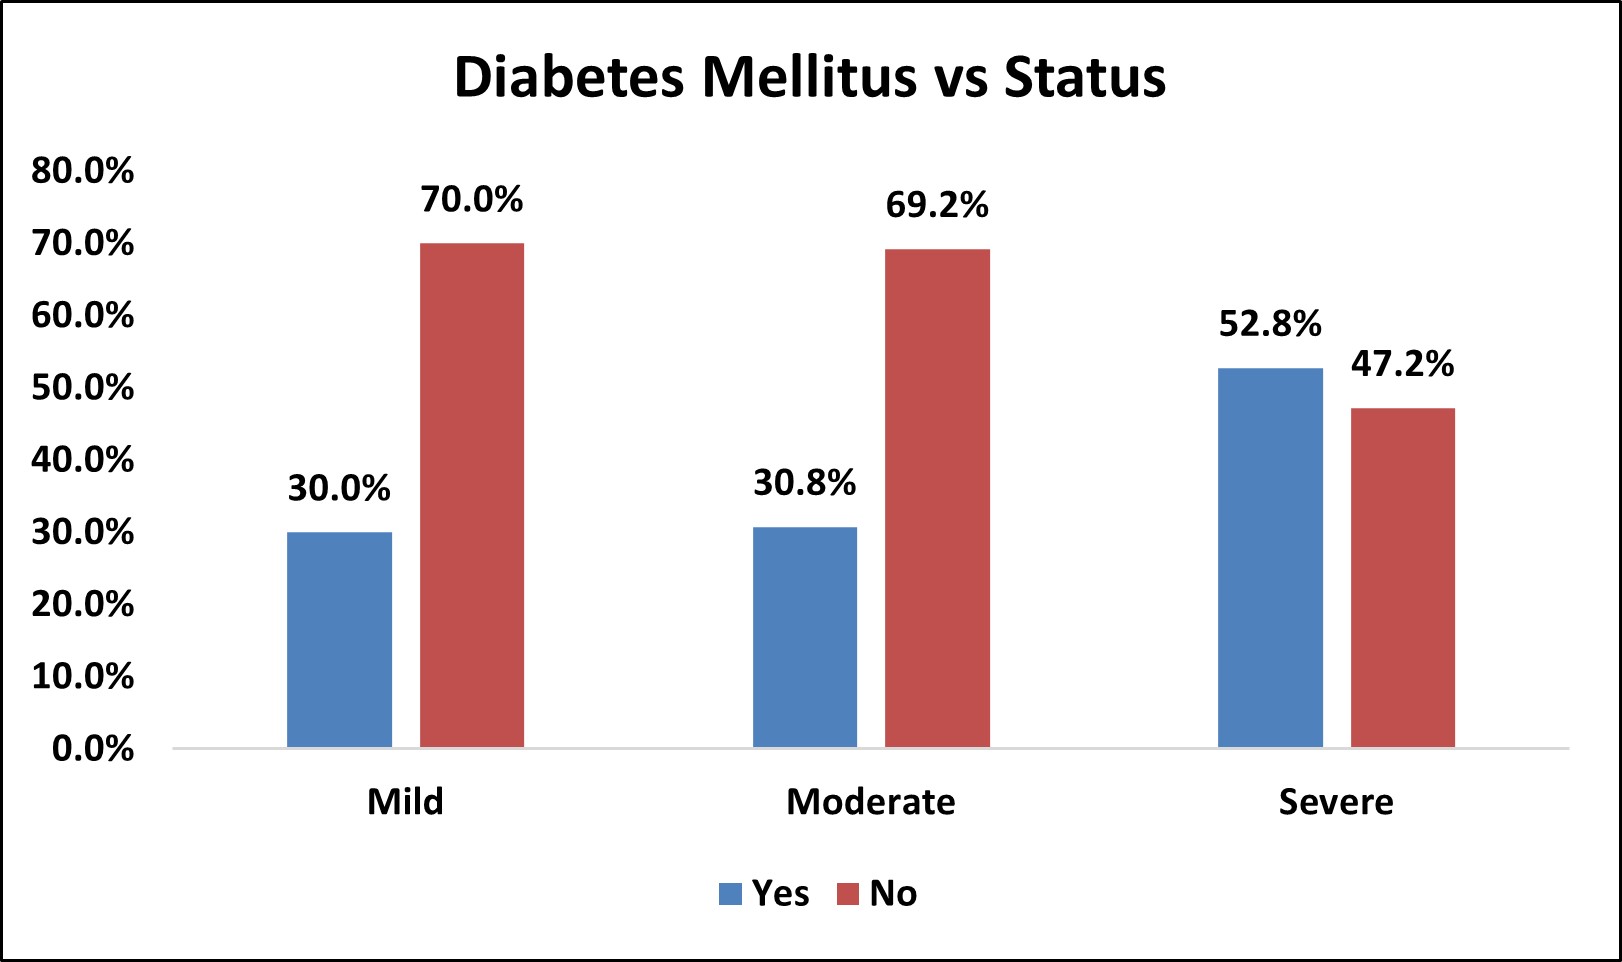
Among the study population, 30 (41.75% ) had diabetes mellitus and 42 (58.3% ) did not have diabetes mellitus.
In mild OSA group, 3 (30%) had diabetes mellitus and 7 (70%) did not have diabetes mellitus.
In moderate OSA group,8 (30.8%) had diabetes mellitus and 18 (69.2%) did not have diabetes mellitus.
In severe OSA group,19 (52.8%) had diabetes mellitus and 17 (47.2%) did not have diabetes mellitus.
There was no statistically significant association between Diabetes mellitus and severity of OSA (p>0.05).
Table 7: Association of Systemic Hypertension with Severity of OSA
| Systemic Hypertension vs Status | |||||||||
|---|---|---|---|---|---|---|---|---|---|
| Systemic Hypertension | Status | Total | % | p Value | |||||
| Mild | % | Moderate | % | Severe | % | ||||
| Yes | 4 | 40.0% | 13 | 50.0% | 25 | 69.4% | 42 | 58.3% | χ2= 0.138 NS |
| No | 6 | 60.0% | 13 | 50.0% | 11 | 30.6% | 30 | 41.7% | |
| Over All | 10 | 26 | 36 | 72 | |||||
Figure 5: Bar Chart Depicting Association of Systemic Hypertension with Severity of OSA

Among the study population, 42 (58.3%) had systemic hypertension and 30 (41.7% ) did not have systemic hypertension.
In mild OSA group, 4 (40%) had systemic hypertension and 6 (60%) did not have systemic hypertension.
In moderate OSA group,13 (50%) had systemic hypertension and 13 (50%) did not have systemic hypertension.
In severe OSA group,25 (69.4%) had systemic hypertension and 11 (30.6%) did not have systemic hypertension.
There was no statistically significant association between systemic hypertension and severity of OSA (p>0.05).
Table 8: Association of Coronary Artery Disease with Severity of OSA
| Coronary Artery Disease vs Status | |||||||||
|---|---|---|---|---|---|---|---|---|---|
| Coronary Artery Disease | Status | Total | % | p Value | |||||
| Mild | % | Moderate | % | Severe | % | ||||
| Yes | 0 | 0.0% | 1 | 3.8% | 3 | 8.3% | 4 | 5.6% | χ2= 0.532 NS |
| No | 10 | 100.0% | 25 | 96.2% | 33 | 91.7% | 68 | 94.4% | |
| Over All | 10 | 26 | 36 | 72 | |||||
Figure 6: Bar Chart Depicting Association Of Coronary Artery Disease (CAD) with Severity of OSA

Among the study population, 4 (5.6%) had CAD and 68 (94.4%) did not have CAD.
In mild OSA group, 0(0%) had CAD and 10 (100%) did not have CAD.
In moderate OSA group, 1 (3.8%) had CAD and 25 (96.2%) did not have coronary CAD.
In severe OSA group, 3 (8.3%) had CAD and 33 (91.7%) did not have CAD.
There was no statistically significant association between CAD and severity of OSA (p>0.05).
Table 9: Association of Chronic Obstructive Pulmonary Disease (COPD) with Severity of OSA
| Chronic Obstructive Pulmonary Disease vs Status | |||||||||
|---|---|---|---|---|---|---|---|---|---|
| Chronic Obstructive Pulmonary Disease(COPD) | Status | Total | % | p Value | |||||
| Mild | % | Moderate | % | Severe | % | ||||
| Yes | 0 | 0.0% | 3 | 11.5% | 5 | 13.9% | 8 | 11.1% | χ2= 0.464 NS |
| No | 10 | 100.0% | 23 | 88.5% | 31 | 86.1% | 64 | 88.9% | |
| Over All | 10 | 26 | 36 | 72 | |||||
Figure 7: Bar Chart Depicting Association of COPD with Severity of OSA
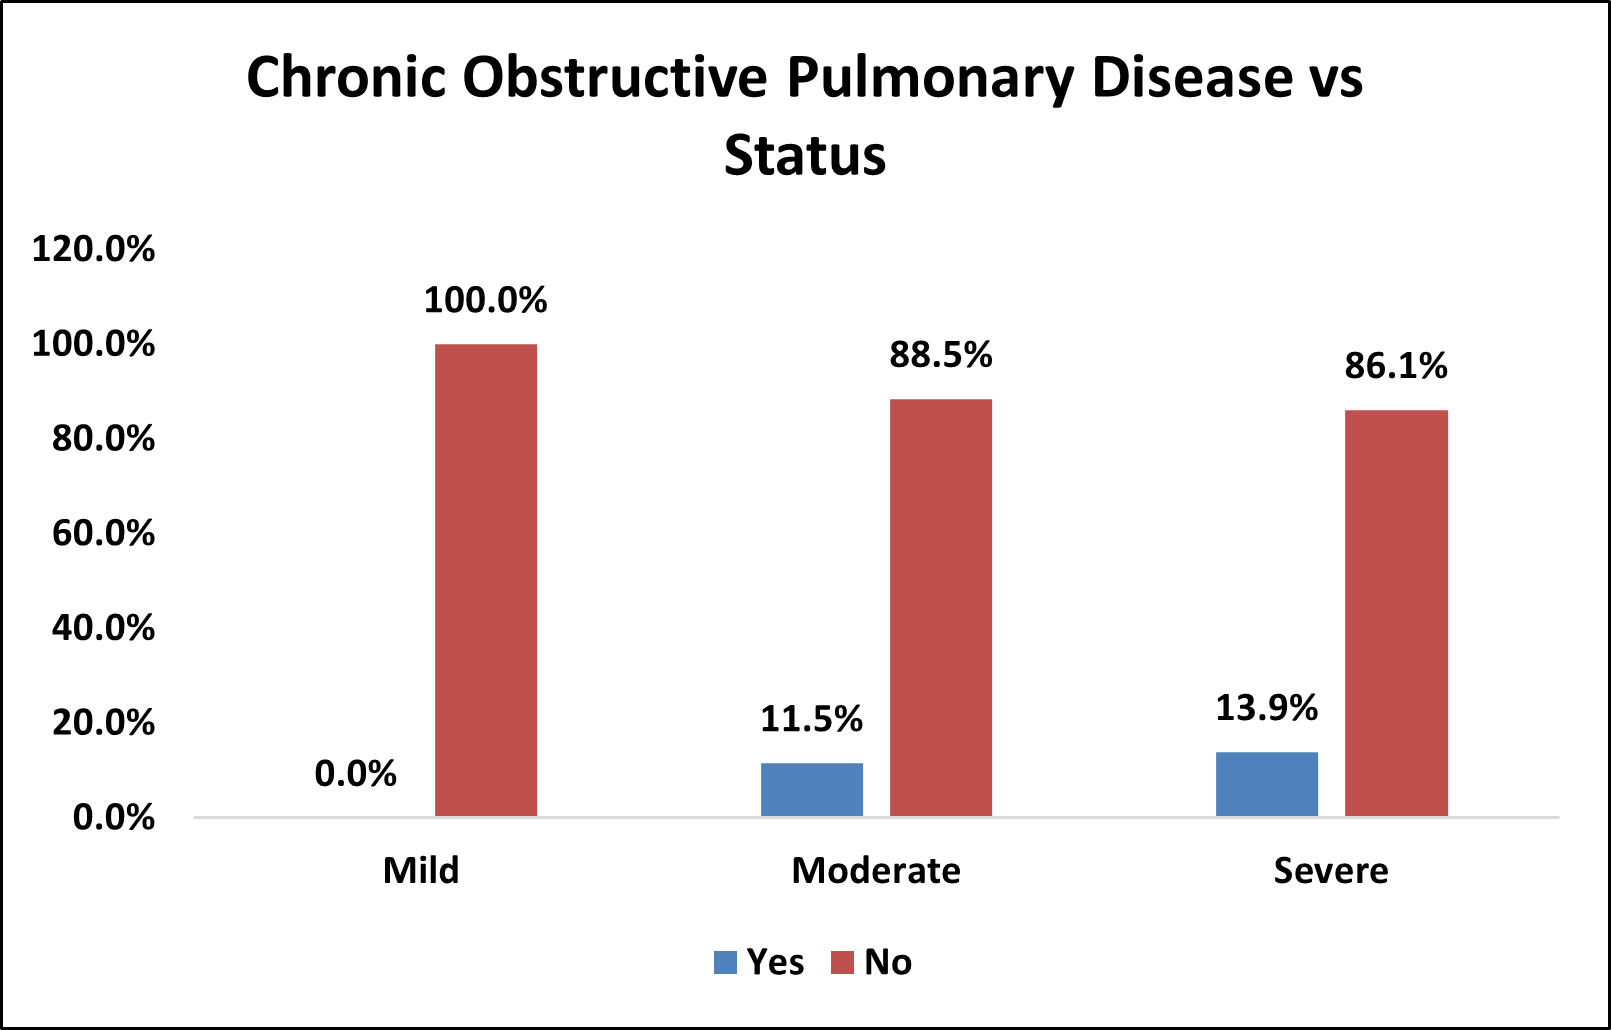
Among the study population,8 ( 11.1% ) had COPD and 64 (88.9% ) did not have COPD.
In mild OSA group, 0( 0% ) had COPD and 10 (100% ) did not have COPD.
In moderate OSA group, 3 ( 11.5% ) had COPD and 23 (88.5% ) did not have COPD.
In severe OSA group, 5 ( 13.9% ) had COPD and 31 (86.1% ) did not have COPD.
There was no statistically significant association between COPD and severity of OSA (p>0.05).
Table 10: Association of Thyroid Disorders with Severity of OSA
| Thyroid Disorders vs Status | |||||||||
|---|---|---|---|---|---|---|---|---|---|
| Thyroid Disorders | Status | Total | % | p Value | |||||
| Mild | % | Moderate | % | Severe | % | ||||
| Yes | 1 | 10.0% | 2 | 7.7% | 3 | 8.3% | 6 | 8.3% | χ2= 0.975 NS |
| No | 9 | 90.0% | 24 | 92.3% | 33 | 91.7% | 66 | 91.7% | |
| Over All | 10 | 26 | 36 | 72 | |||||
Figure 8: Bar Chart Depicting Association of Thyroid Disorders with Severity of OSA
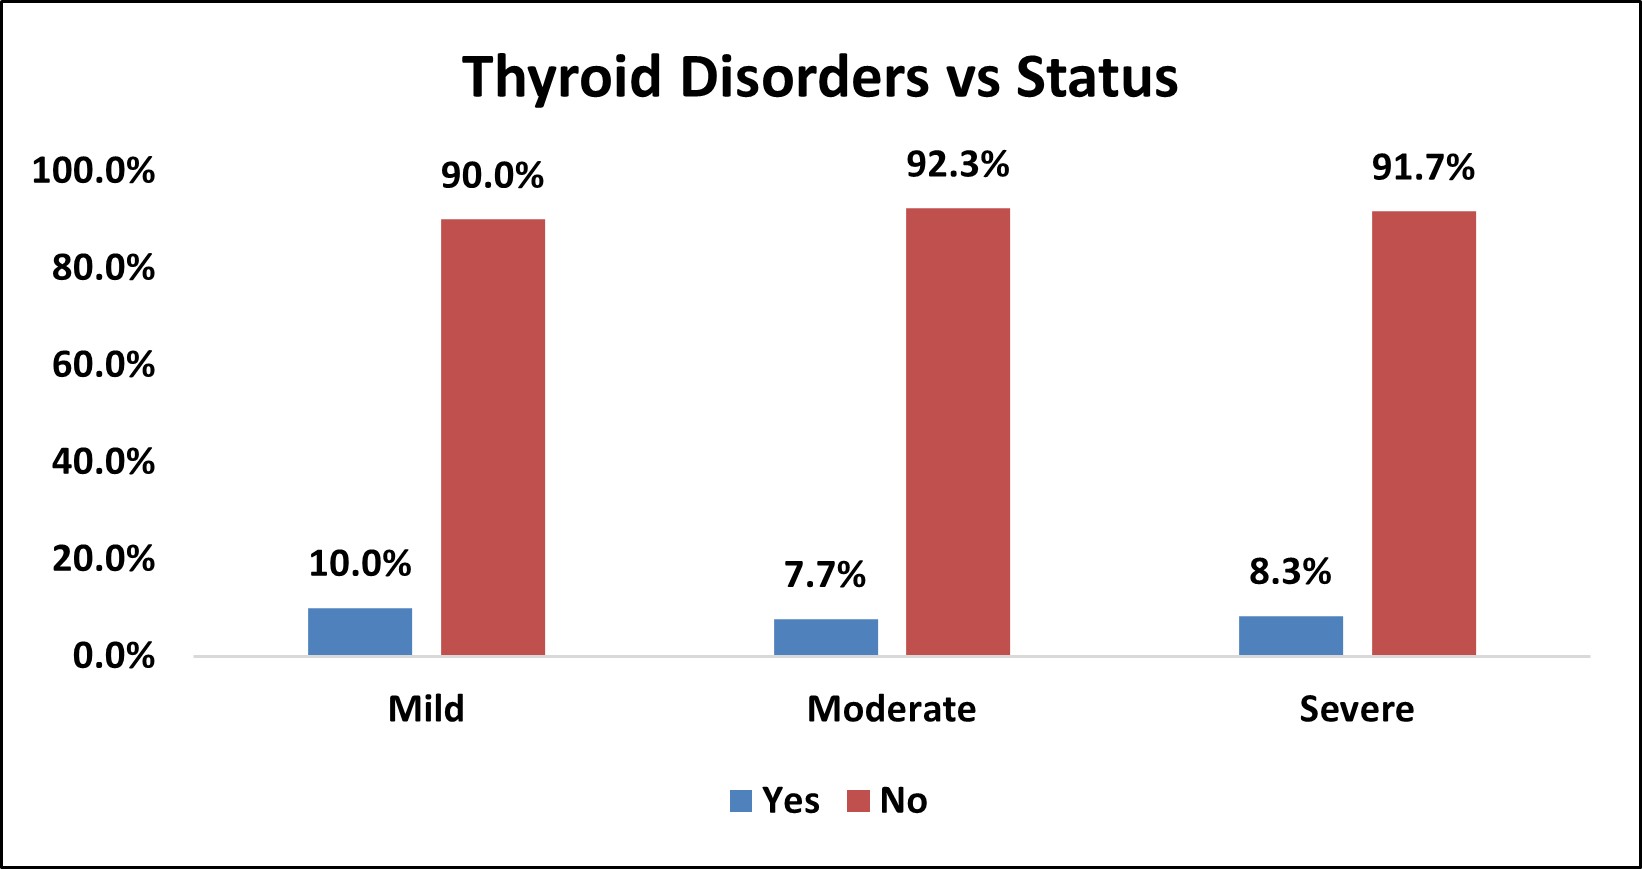
Among the study population,6 (8.3%) had thyroid disorders and 66 (91.7%) did not have thyroid disorders.
In mild OSA group, 1(10%) had thyroid disorder and 9 (90%) did not have thyroid disorders.
In moderate OSA group, 2 (7.7%) had thyroid disorders and 24 (92.3%) did not have thyroid disorders.
In severe OSA group, 3 (8.3% ) had thyroid disorders and 33 (91.7% ) did not have thyroid disorders.
There was no statistically significant association between thyroid disorders and severity of OSA (p>0.05).
Table 11: Association of Mental Health Disorders with Severity of OSA
| Mental Health Disorders vs Status | |||||||||
|---|---|---|---|---|---|---|---|---|---|
| Mental Health Disorders | Status | Total | % | p Value | |||||
| Mild | % | Moderate | % | Severe | % | ||||
| Yes | 1 | 10.0% | 0 | 0.0% | 1 | 2.8% | 2 | 2.8% | χ2= 0.263 NS |
| No | 9 | 90.0% | 26 | 100.0% | 35 | 97.2% | 70 | 97.2% | |
| Over All | 10 | 26 | 36 | 72 | |||||
Figure 9: Bar Chart Depicting Association of Mental Health Disorders with Severity of OSA
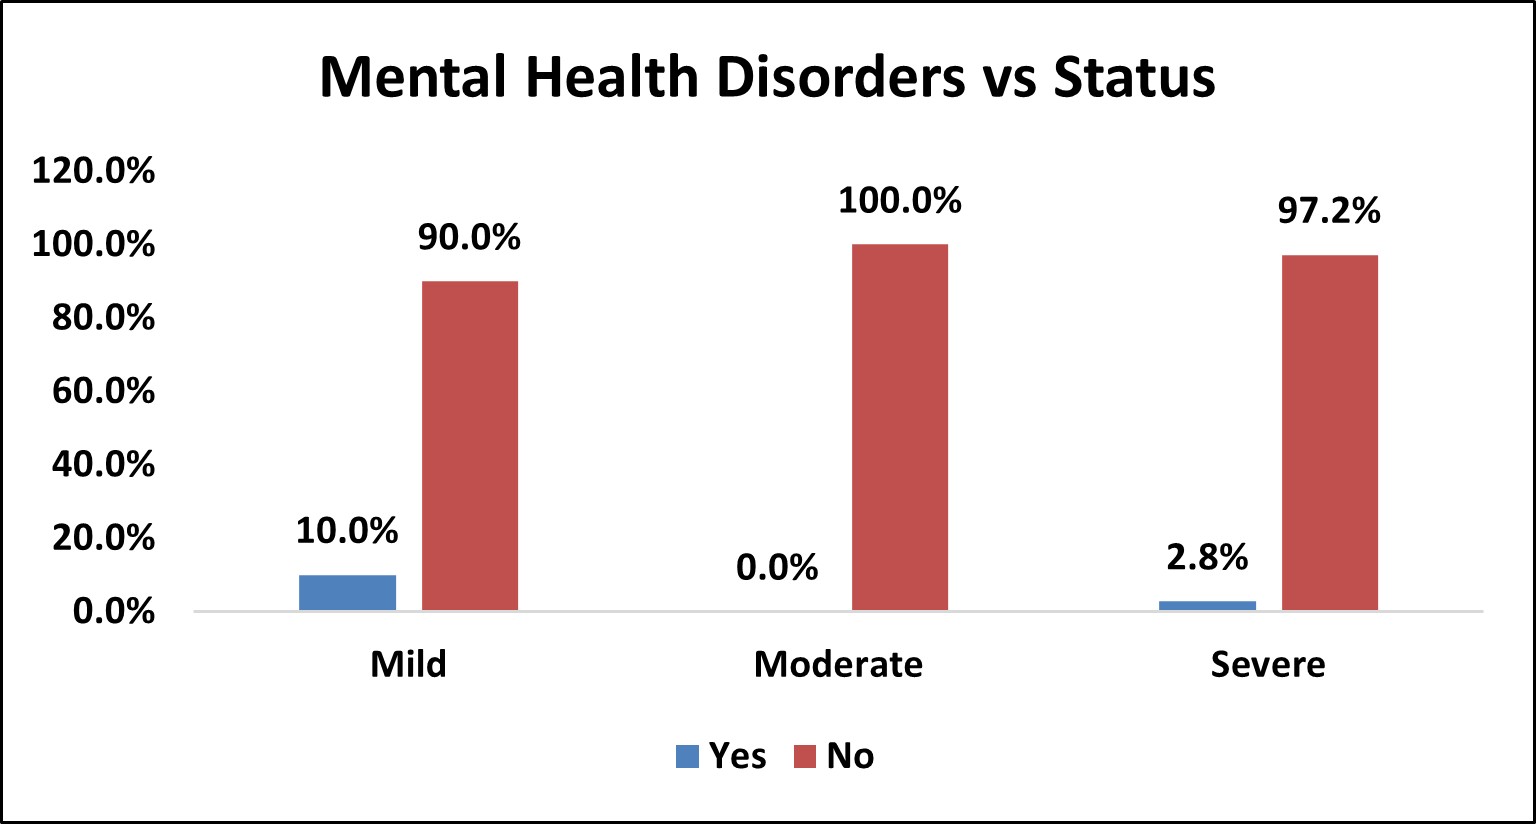
Among the study population,2 (2.8%) had mental health disorders and 70 (97.2%) did not have mental health disorders.
In mild OSA group, 1(10%) had mental health disorders and 9 (90%) did not have mental health disorders.
In moderate OSA group, 26 (100%) did not have mental health disorders.
In severe OSA group, 1 (2.8%) had mental health disorders and 35 (97.2%) did not have mental health disorders.
There was no statistically significant association between mental health disorders and severity of OSA (p>0.05).
Table 12: Association of Dyslipidemia with Severity of OSA
| Dyslipidemia vs Status | |||||||||
|---|---|---|---|---|---|---|---|---|---|
| Dyslipidemia | Status | Total | % | p Value | |||||
| Mild | % | Moderate | % | Severe | % | ||||
| Yes | 3 | 30.0% | 3 | 11.5% | 14 | 38.9% | 20 | 27.8% | χ2= 0.050 SIG |
| No | 7 | 70.0% | 23 | 88.5% | 22 | 61.1% | 52 | 72.2% | |
| Over All | 10 | 26 | 36 | 72 | |||||
Figure 10: Bar Chart Depicting Association of Dyslipidemia with Severity of OSA
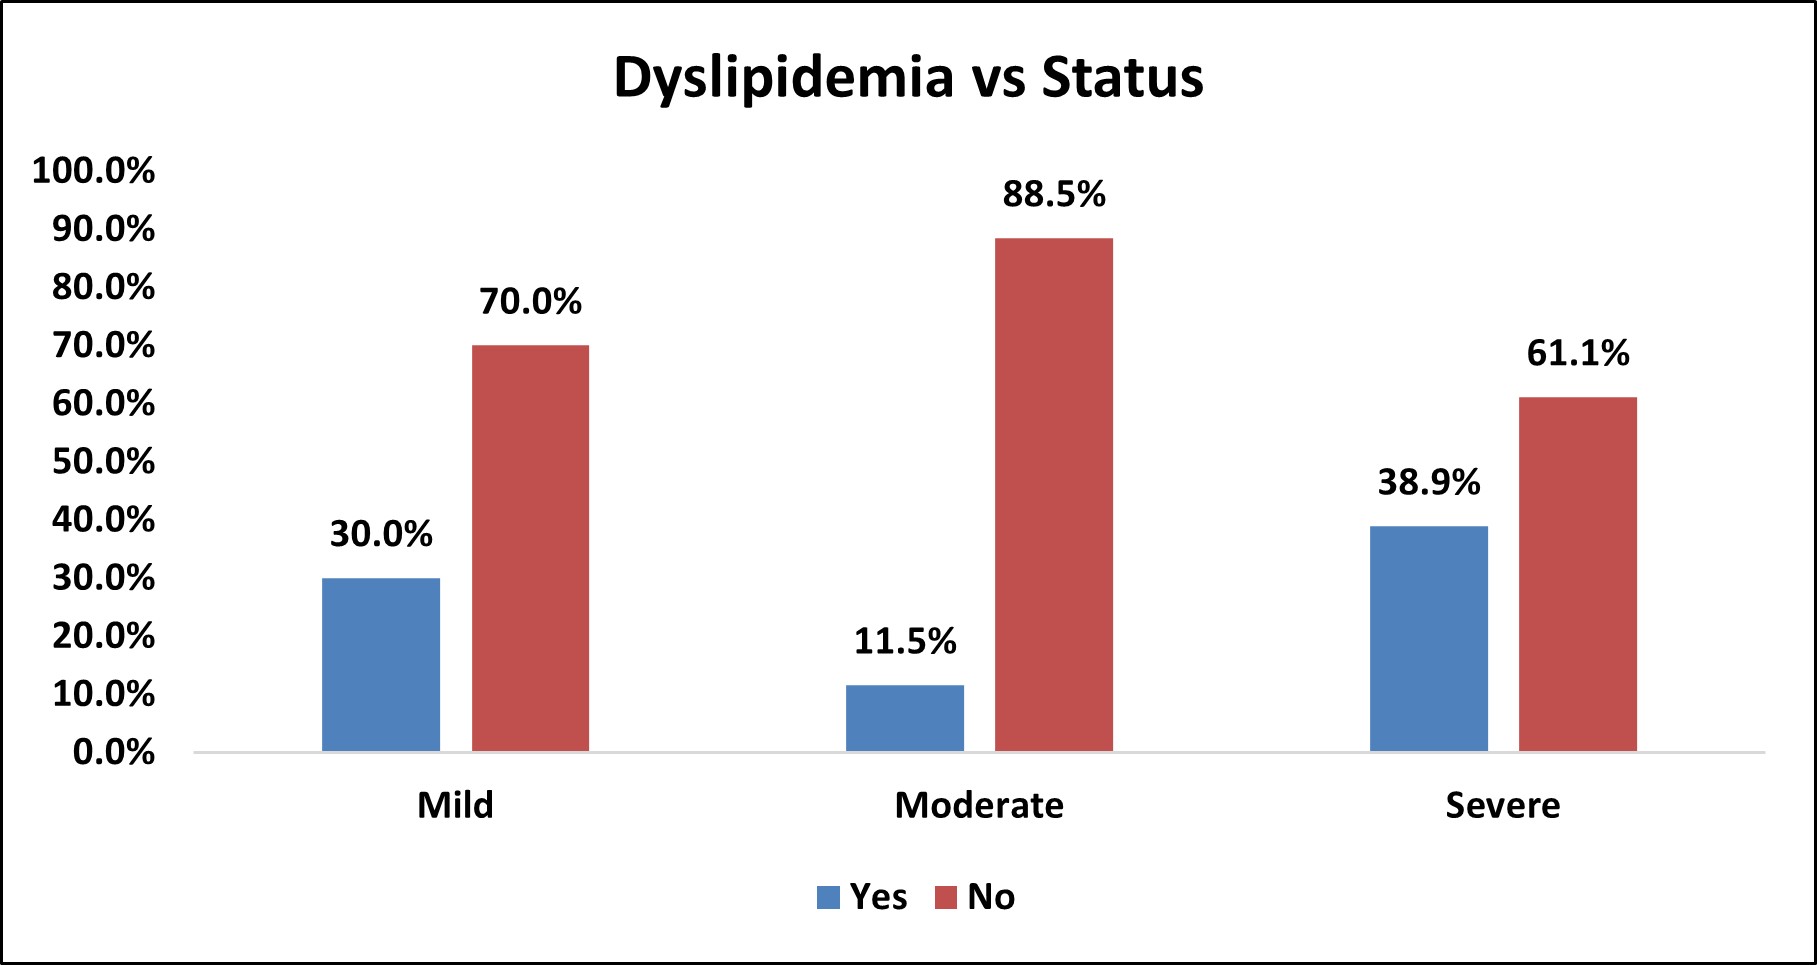
Among the study population,20 (27.8%) had dyslipidemia and 52 (72.2%) did not have dyslipidemia.
In mild OSA group, 3(30%) had dyslipidemia and 7 (70%) did not have dyslipidemia.
In moderate OSA group, 3 (11.5%) had dyslipidemia and 23 (88.5%) did not have dyslipidemia.
In severe OSA group, 14 (38.9%) had dyslipidemia and 22 (61.1% ) did not have dyslipidemia.
There was statistically significant association between dyslipidemia and severity of OSA (p<0.05).
Table 13: Association of Smoking with Severity of OSA
| Smoking vs Status | |||||||||
|---|---|---|---|---|---|---|---|---|---|
| Smoking | Status | Total | % | p Value | |||||
| Mild | % | Moderate | % | Severe | % | ||||
| Yes | 3 | 30.0% | 2 | 7.7% | 8 | 22.2% | 13 | 18.1% | χ2= 0.195 NS |
| No | 7 | 70.0% | 24 | 92.3% | 28 | 77.8% | 59 | 81.9% | |
| Over All | 10 | 26 | 36 | 72 | |||||
Figure 11: Bar Chart Depicting Association of Smoking with Severity of OSA
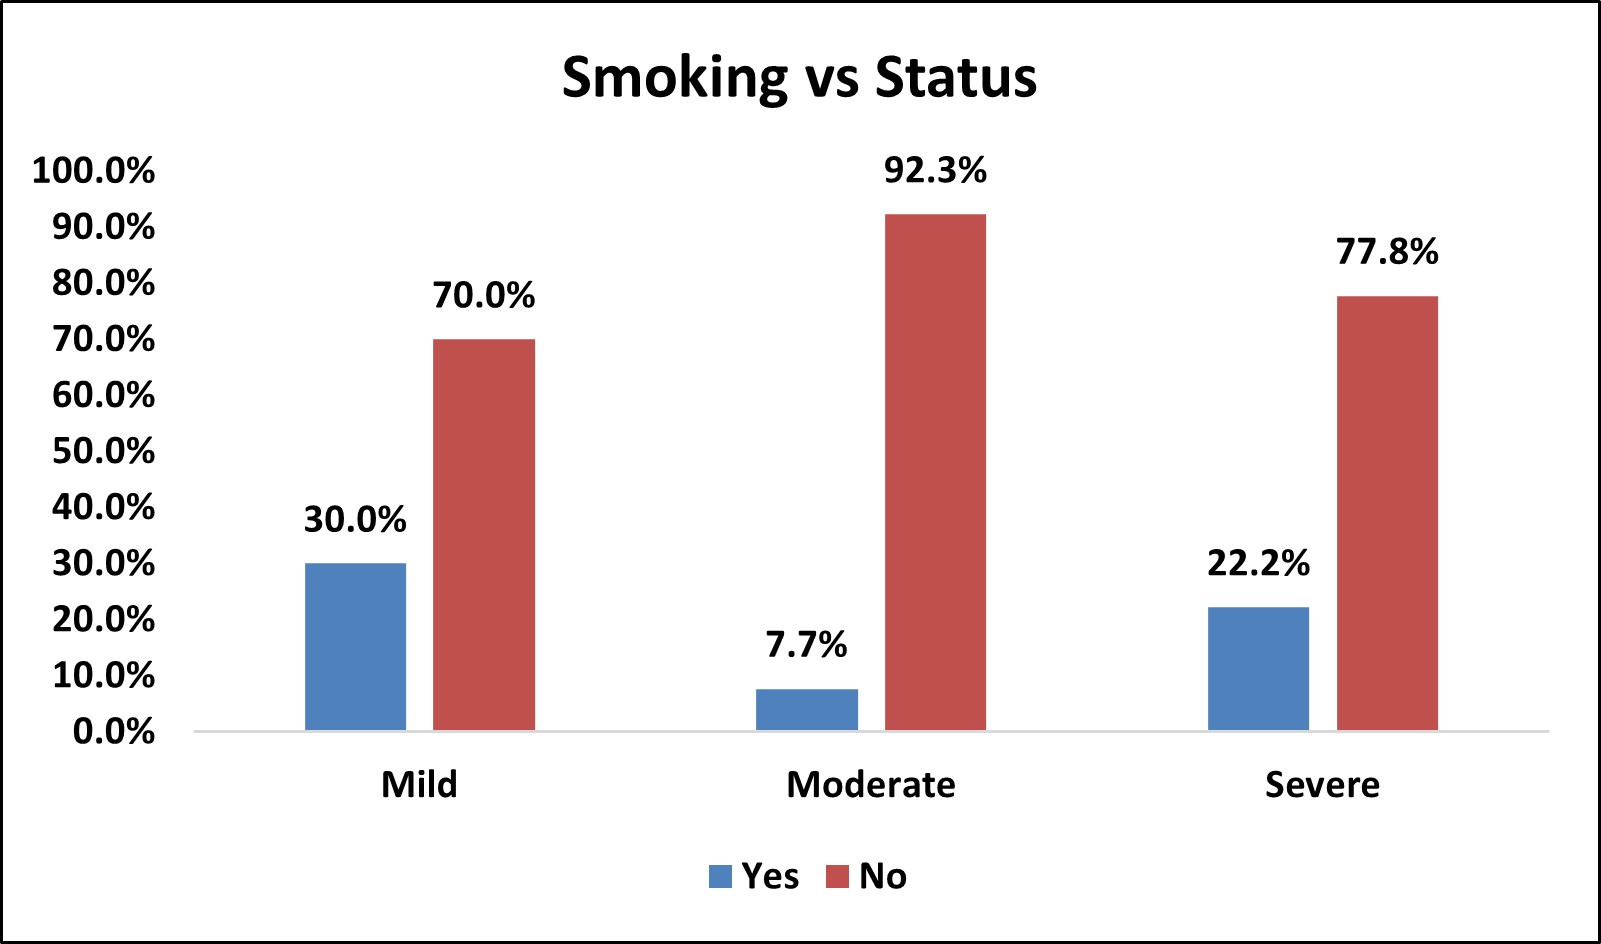
Among the study population, 13( 18.1% ) of them were smokers and 59 (81.9% ) were non smokers.
In mild OSA group, 3 (30%) were smokers and 7 (70%) were non smokers.
In moderate OSA group, 2 (7.7%) were smokers and 24 (92.3%) were non smokers.
In severe OSA group, 8 (22.2%) were smokers and 28 (77.8%) were non smokers.
There was no statistically significant association between smoking and severity of OSA
(p > 0.05).
Table 14: Association of Alcohol Consumption with Severity of OSA
| Alcohol consumption vs Status | |||||||||
|---|---|---|---|---|---|---|---|---|---|
| Alcohol consumption | Status | Total | % | p Value | |||||
| Mild | % | Moderate | % | Severe | % | ||||
| Yes | 2 | 20.0% | 2 | 7.7% | 9 | 25.0% | 13 | 18.1% | χ2= 0.214 NS |
| No | 8 | 80.0% | 24 | 92.3% | 27 | 75.0% | 59 | 81.9% | |
| Over All | 10 | 26 | 36 | 72 | |||||
Figure 12: Bar Chart Depicting Association of Alcohol Consumption with Severity of OSA

Among the study population, 13(18.1%) of them were alcohol consumers and 59 (81.9%) were non alcohol consumers.
In mild OSA group, 2 (20%) were alcohol consumers and 8 (80%) were non-alcohol consumers.
In moderate OSA group, 2 (7.7%) were alcohol consumers and 24 (92.3%) were non-alcohol consumers.
In severe OSA group, 9 (25%) were alcohol consumers and 27 (75%) were non-alcohol consumers.
There was no statistically significant association between alcohol consumption and severity of OSA (p > 0.05).
Table 15: Association of Gastro Esophageal Reflux Disease (GERD) With Severity of OSA
| GERD vs Status | |||||||||
|---|---|---|---|---|---|---|---|---|---|
| GERD | Status | Total | % | p Value | |||||
| Mild | % | Moderate | % | Severe | % | ||||
| Yes | 0 | 0.0% | 1 | 3.8% | 2 | 5.6% | 3 | 4.2% | χ2= 0.735 NS |
| No | 10 | 100.0% | 25 | 96.2% | 34 | 94.4% | 69 | 95.8% | |
| Over All | 10 | 26 | 36 | 72 | |||||
Figure 13: Bar Chart Depicting Association of GERD with Severity of OSA

Among the study population,3 (4.2% ) had GERD and 69 (95.8% ) did not have GERD.
In mild OSA group, 0% had GERD and 10 (100%) did not have GERD.
In moderate OSA group, 1 (3.8%) had GERD and 25 (96.2%) did not have GERD.
In severe OSA group, 2 (5.6%) had GERD and 34 (94.4%) did not have GERD.
There was no statistically significant association between GERD and severity of OSA (p>0.05).
Table 16: Correlation of Anthropometric Parameters of the Study Population with Ahi (Severity of OSA) Based on Pearson Co-Relation Co- Efficient.
Among the anthropometric parameters, weight, BMI, Mallampatti score, NC, WC, WHR and WHtR showed statistically significant positive correlation with AHI.
NWR showed negative correlation with AHI but not statistically significant.
Figure 14: Receiver Operating Characteristic Curve (Roc) Analysis to Determine the Optimal Cutoff Values of the Individual Anthropometric Parameters for Predicting Mild OSA
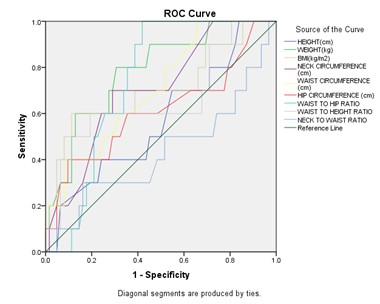
Among all anthropometric parameters, weight had maximum AUC (Area under the ROC curve) and predicts mild OSA at cut off of ≤79 kg with sensitivity 80% and specificity 69.35 %.
Figure 15: Receiver Operating Characteristic Curve (Roc) Analysis to Determine the Optimal Cutoff Values of the Individual Anthropometric Parameters for Predicting Moderate OSA
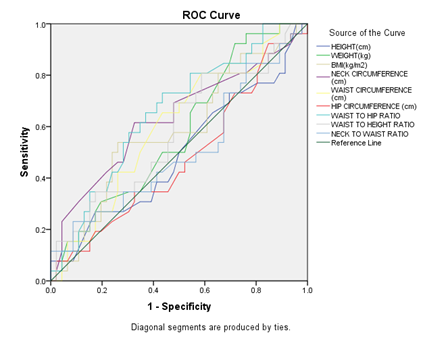
Among all anthropometric parameters, waist to hip ratio (WHR) had maximum AUC ( Area under the ROC curve) and predicts moderate OSA at cut off ≤ 0.97 with sensitivity 73.08% and specificity 56.52%.
Figure 16: Receiver Operating Characteristic Curve (Roc) Analysis to Determine the Optimal Cutoff Values of the Individual Anthropometric Parameters for Predicting Severe OSA
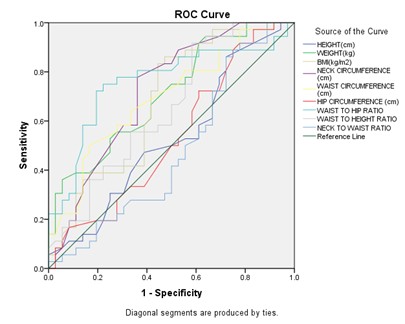
Among all anthropometric parameters, waist to hip ratio (WHR) had maximum AUC (Area under the ROC curve) and predicts severe OSA at cut off > 0.95 with sensitivity 75% and specificity 77.78%.
Table 17 Depicting The Cutoff Values of Anthropometric Parameters for Predicting Severity Groups of OSA in the Given Population
| Parameters | Mild | Moderate | Severe | |
|---|---|---|---|---|
| BMI | kg/m2 | ≤25.14 | ≤29.86 | >28.76 |
| sensitivity(%) | 60.00 | 53.85 | 86.11 | |
| specificity(%) | 88.71 | 73.91 | 52.78 | |
| NC | cm | ≤39 | ≤40 | >40 |
| sensitivity(%) | 70.00 | 61.54 | 77.78 | |
| specificity(%) | 70.97 | 67.39 | 63.89 | |
| WHR | ≤0.95 | ≤0.97 | >0.95 | |
| sensitivity(%) | 100.00 | 73.08 | 75.00 | |
| specificity(%) | 58.06 | 56.52 | 77.78 | |
Discussion
OSA is considered the most severe form of sleep related breathing disorders. Obesity, particularly central obesity, is significantly associated with an increased prevalence of OSA. Although PSG is considered as an essential gold standard tool for screening and diagnosing OSA, it is costly, complex, not readily available and difficult to access, especially in underdeveloped countries, expensive, and requires expert technical services .
Therefore, a simpler and less costly method is required as a screening method for OSA. There is a vast amount of scientific literature on cephalometric and anthropometric measures, which compares control groups and snorers to OSA patients and aims at using these measurements as predictors of this condition. Some studies have been performed to assess appropriate treatments, surgical treatment plans, and the indications of intraoral devices, while others were performed to evaluate the relationship between these measurements and OSA severity.
The present study analyzed various anthropometric indices and clinical profile of OSA patients and their associations with the the severity. A total of 72 adult patients confirmed to have OSA by overnight PSG who had undergone anthropometric measurements, including weight, height, MI, NC, WC, HC.
In the present study, there was a statistically significant increased values of parameters such as Weight,BMI, NC, WC ,WHR and WHtR in patients with confirmed OSA in relation with severity (Table 2).
The severity of OSA was higher in men compared with women as they had higher AHI compared with female patients (Table 3). This is in accordance with the studies by Wang et al.29, who have reported that women with OSA had lesser respiratory disturbances compared with male patients, despite their higher age, and the severity of OSA was significantly higher among male patients. The mechanisms that potentially explain this difference may include the following: significant variation in body fat distribution, dimensions, diameters, and collapsibility of the upper airways, hormonal status, and variability in ventilation control. In particular, sex hormone variability is a well known recognized risk factor for OSA in women.
For many Asian populations, the current World Health Organization (WHO) BMI cut-off values have been identified as 23 kg/m2 or higher for an increased risk for obesity, 25 kg/m2 or higher for being overweight, and 27.5 kg/m2 or higher for a high risk for obesity34. In our study, There was statistically significant association between BMI and severity of OSA ( p < 0.05 ) (Table 4).
As regards the efficacy of BMI as a predictor of OSA, wide variations in the cutoff values were found among different populations in several studies, thus supporting the present study results that rendered BMI as a less significant and less sensitive index for assessing severity compared with NC and WC (Table 16); this may be attributed to the fact that Asians were found to have a higher percentage of body fat compared with White of the same age, sex, and BMI33. For this reason, a proportion of the Asian population with a high risk for developing OSA might have BMIs below the existing BMI cutoff value of 25 kg/m2 , and hence different phenotypic features may contribute differently to the development of OSA.
In our study mallampatti score correlates significantly with OSA severity (Table 5). This is in accordance with a study by Nuckton TJ, Glidden DV, Browner WS, Claman DM 35 where the Mallampati score was an independent predictor of both the presence and severity of obstructive sleep apnea. On average, for every 1-point increase in the Mallampati score, the odds of having obstructive sleep apnea (apnea-hypopnea index> or = 5) increased more than 2-fold (odds ratio [per 1-point increase] = 2.5; 95% confidence interval: 1.2-5.0; p = .01), and the apnea-hypopnea index increased by more than 5 events per hour (coefficient = 5.2; 95% confidence interval: 0.2-10; p = .04).
Among patients with Diabetes mellitus, systemic hypertension and COPD, non significant statistical frequency of severe OSA is high.(Table 6,7 and 9).
In our study, there was statistically significant association between dyslipidemia and severity of OSA (p<0.05) (Table 12). This is in accordance with a retrospective cohort study by Popadic V, Brajkovic Met al36 on 328 patients with newly diagnosed obstructive sleep apnea which showed a significant correlation of lipid abnormalities and inflammatory markers with Apnea-Hypopnea Index (AHI) as an indicator of obstructive sleep apnea severity. According to Drager et al. (2018)37, the main mechanisms involved in higher cholesterol and triglycerides levels in patients with OSA are increased hepatic triglyceride and cholesterol production, decreased clearance by lipase activity inhibition, and increased free fatty acid mobilization from adipose tissue
There was a highly significant positive correlation of weight, BMI, NC, WC, WHR and WHtR with AHI but a nonsignificant positive correlation of age , height, HC with AHI and ,also a nonsignificant negative correlation of NWR with AHI (severity of OSA) (Table 16). These are in accordance with the study performed by Hyeon et al.30 in which NC was considered as a more potent significant predictor for the presence and diagnosis of OSA and its severity compared with other anthropometric variables such as WC and BMI. They concluded that NC reflected upper body obesity and was considered to be a better and more valuable marker compared with BMI, WC, or HC for OSA. These were also in agreement with previous study Young et al.31 who have reported that there was a great association between obesity and OSA, and they also found that patients with OSA had a significantly higher age, BMI, WC, and NC compared with patients without OSA. Yamagishi et al.32 supported the present study results, as they found that the risk for OSA further increases in individuals with upper body obesity. This may be attributed to the fact that obese OSA patients have a bigger tongue and a narrower upper airway passage.
NC is an easily obtainable measurable index with the use of only a tape measure, so it is a useful valuable measure in clinical practice. In the present study, highest significant correlation was found between NC and the severity of OSA. Lesser significance was found between BMI and OSA severity. However, no significant correlation was found between HC or NWR and OSA. A study by Pinto et al.38 found that NC is a more reliable estimate of OSA severity; however, when NC was combined with BMI, WC, or any other anthropometric measure separately, its predictive ability decreased.
In accordance with the study conducted by Wang Y, Mao L, Zhang X et al17where WHR was positively correlated with AHI (r = 0.22, p < 0.001), AI (r = 0.270, p = 0.004), and ODI (r = 0.286, p = 0.0022) and negatively correlated with lowest oxygen pulse saturation (LSpO2) (r = 0.246, p = 0.008), our study revealed that WHR with cut-off point of > 0.95 with sensitivity 75% and specificity 77.78%. (p < 0.05) to predict severe OSA.
In our study, Receiver operating characteristic curve (ROC) analysis to determine the optimal cutoff values of the individual anthropometric parameters for predicting moderate OSA and severe OSA (Figure 15 and 16) revealed maximum AUC for WHR with cut off ≤ 0.97 with sensitivity 73.08% specificity 56.52% and > 0.95 with sensitivity 75% and specificity 77.78% respectively.
Receiver operating characteristic curve (ROC) analysis to determine the optimal cutoff values of the individual anthropometric parameters for predicting mild OSA (Figure 14) revealed maximum AUC for Weight with cut off ≤79 kg with sensitivity 80% and specificity 69.35 %.
From our study, the cutoff values of anthropometric parameters (Table 17) for predicting mild, moderate and severe OSA were determined as ≤39cm,≤40cm and >40cm for neck circumference respectively ,as for BMI ≤25.14 kg/m2, ≤29.86 kg/m2 and >28.76 kg/m2 respectively and as for waist hip ratio(WHR) ≤0.95 , ≤0.97 and >0.95 respectively.
LIMITATIONS
There are limitations to this study.
Firstly, this was a cross-sectional study. We could not determine the actual effect of anthropometric parameters and clinical profile of the patients on the development and severity of OSA.
Secondly, we enrolled only those patients who visited the sleep apnea clinic of a tertiary hospital in south India. Thus, it may not be possible to extrapolate our findings to the general population.
Co-morbidities were taken into consideration from history obtained from patients’ knowledge. Possibility of undiagnosed co-morbidities and recall bias among them is high.
Finally, we did not design interventions to improve the body habitus and study its impact on the severity of OSA on follow-up.
Summary and Conclusion
Summary of analysis of results:
- Among the anthropometric parameters, weight, BMI, neck circumference, waist circumference and waist to hip ratio and waist to height ratio show statistical significance for mild, moderate and severe OSA groups.
- Severity of OSA was higher in men compared with women as they had higher AHI compared with female patients.
- Among patients with Diabetes mellitus ,systemic hypertension and COPD there was high frequency of Severe OSA but was statistically less significant.
- Dyslipidemia was significantly associated with severity of OSA.
- Mallampatti score correlates significantly with OSA severity
- There was a highly significant positive correlation Neck Circumference, Body Mass Index , Waist Circumference, Waist Hip Ratio, Waist Height Ratio and mallampatti score with AHI but a nonsignificant positive correlation of age , height, Hip Circumference with AHI and ,also a nonsignificant negative correlation of Neck Waist Ratio with AHI
- In the present study, highest significant correlation was found between NC and the severity of OSA. Lesser significance was found between BMI and OSA severity. However, no significant correlation was found between HC or NWR and OSA.
- Weight had maximum AUC (Area under the ROC curve) and predicts mild OSA with cut off ≤79 kg with sensitivity 80% and specificity 69.35 %
- Waist to hip ratio (WHR ) had maximum AUC ( Area under the ROC curve) and predicts moderate OSA at a cutoff ≤ 0.97 with sensitivity 73.08% specificity 56.52% and severe OSA at a cutoff > 0.95 with sensitivity 75% and specificity 77.78%
- The cutoff values of anthropometric parameters for predicting mild, moderate and severe OSA were determined as ≤39cm ,≤40cm and >40cm for neck circumference respectively ,as for BMI ≤25.14 kg/m2, ≤29.86 kg/m2 and >28.76 kg/m2 respectively and as for waist hip ratio(WHR) ≤0.95 , ≤0.97 and >0.95 respectively.
Conclusions
In conclusion, in our limited study, there was statistically significant association between gender, mallampatti score ,dylipidemia and OSA severity groups.
Among anthropometric parameters weight, BMI, neck circumference, waist circumference and waist to hip ratio and waist to height ratio were significantly associated with the severity of OSA.
NC was statistically more positively correlated with OSA severity (AHI) and might be of better use than other indices when describing a patient with OSA.
In addition, this limited study demonstrated the cut-off values of BMI, NC, WHR that predict the OSA severity category.
References
- American academy of sleep medicine https://aasm.org/resources/factsheets/sleepapnoea.pdf
- Reddy EV, Kadhiravan T, Mishra HK, Sreenivas V, Handa KK, Sinha S, Sharma SK. Prevalence and risk factors of obstructive sleep apnoea among middle-aged urban Indians: a community-based study. Sleep Med. 2009 Sep;10(8):913-8. doi: 10.1016/j.sleep.2008.08.011. Epub 2009 Mar 23. PMID: 19307155.
- ERJ Open Research2023; 9: Suppl. 11, 58.
- Sankri-Tarbichi AG. Obstructive sleep apnoea-hypopnoea syndrome: Etiology and diagnosis. Avicenna J Med. 2012 Jan;2(1):3-8. doi: 10.4103/2231-0770.94803. PMID: 23210013; PMCID: PMC3507069.
- Slowik JM, Sankari A, Collen JF. Obstructive Sleep Apnoea. [Updated 2024 Mar 21]. In: StatPearls [Internet]. Treasure Island (FL): StatPearls Publishing; 2024 Jan-. Available from: https://www.ncbi.nlm.nih.gov/books/NBK459252/
- Ali, E.R., Mohamad, A.M. Evaluation of the efficiency of anthropometric parameters and submental ultrasonographic indices as predictors for screening of obstructive sleep apnoea and its severity. Egypt J Bronchol11, 355–366 (2017). https://doi.org/10.4103/ejb.ejb_17_17
- American Academy of Sleep Medicine. International classification of sleep disorders. 3rd ed. Darien, IL: American Academy of Sleep Medicine, 2014.
- AASM Manual for the Scoring of Sleep and Associated Events Version 2.3. Darien, IL: American Academy of Sleep Medicine, 2016
- May AM, Mehra R, Semin Respir Crit Care Med.3 B 2014 Thieme Medical Publishers, Inc. thieme-connect.com/DOI/DOI?10.1055/s-0034-1390023
- Gold AR, Schwartz AR. The pharyngeal critical pressure. The whys and hows of using nasal continuous positive airway pressure diagnostically. Chest 1996;110(4): 1077Y1088.
- Young T, Shahar E, Nieto FJ, et al. Predictors of sleep-disordered breathing in community-dwelling adults: the Sleep Heart Health Study. Arch Intern Med 2002;162(8):893Y900. doi:10.1001/ archinte.162.8.893.
- Phillips B, Kato M, Narkiewicz K, Choe I, Somers V. Increases in leptin levels, sympathetic drive, and weight gain in obstructive sleep apnoea. Am J Physiol Heart Circ Physiol 2000; 279:234–237.
- Subramanian : G. Jayaraman : H. Majid : S. Surani Department of Medicine, Division of Pulmonary, Critical Care and Sleep Medicine, Baylor College of Medicine, Houston, TX, USA Sleep Breath (2012) 16:1091–1095 DOI 10.1007/s11325-011-0607-9
- Peppard PE, Young T, Barnet JH, et al. Increased prevalence of sleep-disordered breathing in adults. Am J Epidemiol 2013; 177(9):1006Y1014. doi:10.1093/aje/kws342
- Borges Pde T, Filho ES, Araujo TM, Neto JM, Borges NE, Neto BM, Campelo V, Paschoal JR, Li LM. Correlation of cephalometric and anthropometric measures with obstructive sleep apnoea severity. Int Arch Otorhinolaryngol. 2013 Jul;17(3):321-8. doi: 10.7162/S1809-977720130003000013. PMID: 25992029; PMCID: PMC4423249.
- Prevalence of sleep-disordered breathing in the general population: the HypnoLaus study R Heinzer, S Vat, P Marques-Vidal, H Marti-Soler, D Andries, N Tobback, V Mooser, M Preisig, A Malhotra, G Waeber, P Vollenweider, M Tafti,* J Haba-Rubio https://doi.org/10.1016/S2213-2600(15)00043-0
- Wang Y, Mao L, Zhang X. Waist-hip ratio is an independent predictor of moderate-to-severe OSA in nonobese males: a cross-sectional study. BMC Pulm Med. 2022 Apr 22;22(1):151. doi: 10.1186/s12890-022-01886-3. PMID: 35459124; PMCID: PMC9034636.
- Yeghiazarians Y, Jneid H, Tietjens JR, Redline S, Brown DL, El-Sherif N, Mehra R, Bozkurt B, Ndumele CE, Somers VK. Obstructive Sleep Apnoea and Cardiovascular Disease: A Scientific Statement From the American Heart Association. Circulation. 2021 Jul 20;144(3):e56-e67. doi: 10.1161/CIR.0000000000000988. Epub 2021 Jun 21. Erratum in: Circulation. 2022 Mar 22;145(12):e775. doi: 10.1161/CIR.0000000000001043. PMID: 34148375.
- Amra B, Pirpiran M, Soltaninejad F, Penzel T, Fietze I, Schoebel C. The prediction of obstructive sleep apnoea severity based on anthropometric and Mallampati indices. J Res Med Sci. 2019 Jul 24;24:66. doi: 10.4103/jrms.JRMS_653_18. PMID: 31523252; PMCID: PMC6669992.
- Kang HH, Kang JY, Ha JH, Lee J, Kim SK, Moon HS, Lee SH. The associations between anthropometric indices and obstructive sleep apnoea in a Korean population. PLoS One. 2014 Dec 4;9(12):e114463. doi: 10.1371/journal.pone.0114463. PMID: 25474257; PMCID: PMC4256422.
- Yildirim Y, Yilmaz S, Güven M, Kılınç F, Kara AV, Yilmaz Z, Kırbaş G, Tuzcu AK, Yılmaz Aydın F. Evaluation of Anthropometric and Metabolic Parameters in Obstructive Sleep Apnoea. Pulm Med. 2015;2015:189761. doi: 10.1155/2015/189761. Epub 2015 Jul 14. PMID: 26257957; PMCID: PMC4516841.
- Kim JH, Koo YC, Cho HJ, Kang JW. Relationship between various anthropometric measures and apnoea-hypopnoea index in Korean men. Auris Nasus Larynx. 2018 Apr;45(2):295-300. doi: 10.1016/j.anl.2017.05.005. Epub 2017 May 22. PMID: 28546036.
- Henri Tuomilehto, Juha Seppä, Matti Uusitupa,Obesity and obstructive sleep apnoea-Clinical significance of weight loss,Sleep Medicine Reviews,Volume 17, Issue 5,2013,Pages 321-329,ISSN 1087-0792,https://doi.org/10.1016/j.smrv.2012.08.002.(https://www.sciencedirect.com/science/article/pii/S1087079212000974)
- GottliebDJ ,Yenokyan G, Newman AB, et al Prospective study of obstructive sleep apnoea and incident coronary artery disease and heart failure: the sleep heart health study. Circulation 2010; 122: 352–360. doi:1161/CIRCULATIONAHA.109.901801
- Kim V,Han MK,Vance GB, et al. The chronic bronchitic phenotype of COPD: an analysis of the COPDGene study. Chest 2011; 140: 626–633. doi:1378/chest.10-2948
- Renner B, Mueller CA, Shephard A.,Environmental and non-infectious factors in the aetiology of pharyngitis (sore throat). Inflamm Res 2012; 61: 1041–1052. doi:1007/s00011-012-0540-9
- Fang H,Tu S,Sheng J, et al. Depression in sleep disturbance: a review on a bidirectional relationship, mechanisms and treatment. J Cell Mol Med 2019; 23: 2324–2332. doi:1111/jcmm.14170
- Ong JC,Gress JL,San Pedro-Salcedo MG, et al. Frequency and predictors of obstructive sleep apnoea among individuals with major depressive disorder and insomnia. J Psychosom Res 2009; 67: 135–141. doi:1016/j.jpsychores.2009.03.011
- Wang J, Thornton J, Russell M, Burastero S, Heymsfield S, Pierson R. Asians have lower body mass index (BMI) but higher percent body fat than do whites: comparisons of anthropometric measurements.Am J Clin Nutr 2014; 60:29–35.
- Hyeon H, Young K, Jick H, Jongmin L, Sung K, Kim H, et al. The associations between anthropometric indices and obstructive sleep apnoea. PLoS One 2014; 9:1–12
- Young T, Peppard P, Taheri S. Excess weight and sleep-disordered breathing. J Appl Physiol 2005; 99:1592–1599.
- Yamagishi K, Ohira T, Nakano H, Bielinski SJ, Sakurai S. Cross-cultural comparison of the sleep-disordered breathing prevalence among Americans and Japanese. Eur Respir J 2010; 36:379–384.
- Soylu A, Villaneuva A, Buchanan P, Yurtlu S. Evaluation of a prediction model for sleep apnoea in patients submitted to polysomnography. J Bras Pneumol 2011; 37:75–84.
- WHO Expert Consultation (2004) Appropriate body-mass index for Asian populations and its implications for policy and intervention strategies. Lancet 363: 157–163.
- Nuckton TJ, Glidden DV, Browner WS, Claman DM. Physical examination: Mallampati score as an independent predictor of obstructive sleep apnoea. Sleep. 2006 Jul;29(7):903-8. doi: 10.1093/sleep/29.7.903. PMID: 16895257.
- Popadic V, Brajkovic M, Klasnja S, Milic N, Rajovic N, Lisulov DP, Divac A, Ivankovic T, Manojlovic A, Nikolic N, Memon L, Brankovic M, Popovic M, Sekulic A, Macut JB, Markovic O, Djurasevic S, Stojkovic M, Todorovic Z and Zdravkovic M (2022) Correlation of Dyslipidemia and Inflammation With Obstructive Sleep Apnea Severity. Front. Pharmacol. 13:897279. doi: 10.3389/fphar.2022.897279
- Drager, L. F., Tavoni, T. M., Silva, V. M., Santos, R. D., Pedrosa, R. P., Bortolotto, L. A., et al. (2018). Obstructive Sleep Apnea and Effects of Continuous Positive Airway Pressure on Triglyceride-Rich Lipoprotein Metabolism. J. Lipid Res. 59 (6), 1027–1033. doi:10.1194/jlr.M083436
- Pinto JA, Godoy LB, Marquis VW, Sonego TB, Leal Cde F. Bilateral vocal fold immobility: diagnosis and treatment. Braz J Otorhinolaryngol., 2011; 77(5): 594-99. doi: 10.1590/s1808-86942011000500010.
- Schwab R.J. (2020, June). Snoring. Merck Manual Professional Version., Retrieved April 28, 2021, from https://www.msdmanuals.com/professional/neurologic-disorders/sleep-and-wakefulness-disorders/snoring
- Obstructive sleep apnoea, adult. In: Sateia M, editor. ICSD-3. Chicago: AASM 2014
- Ko J, Lim JH, Kim DB, Joo MJ, Jang YS, Park EC, Shin J. Association between alcohol use disorder and risk of obstructive sleep apnea. J Sleep Res. 2024 Aug;33(4):e14128. doi: 10.1111/jsr.14128. Epub 2023 Dec 19. PMID: 38112217.
- Lin CC, Tsan KW, Chen PJ. The relationship between sleep apnea syndrome and hypothyroidism. Chest. 1992;102(6):1663–1667.