Time in Range (TIR) In Diabetes: A Concept of Control of Glycemia, Whose Time Has Come
M. Ravikeerthy1,*, KM. Hamsa2
1Director Internal Medicine, Kauvery Hospital ECB, Bengaluru, India
2Registrar Internal Medicine, Kauvery Hospital ECB, Bengaluru, India
*Correspondence: Tel.: +91 9845295227; email: ravikeerthym@gmail.com
An Overview
It has been more than two years since the release of recommendations from the International Consensus Guidelines on Time-in-Range (TIR) in patients with diabetes who are on continuous blood glucose monitoring (CGM), but awareness is poor about the importance of TIR as a metric for the understanding of the duration of euglycemia (70-180 mg/dl) and as an useful measure of the risk of developing long term complications.
This article is a review of the guidelines, definitions of Time in Range (TIR), Time Above Range (TAR), Time Bellow Range (TBR) terminologies, recommended targets for type 1 and type 2 diabetes and less stringent targets for high risk and older individuals, the correlation between HbA1c and TIR as a metric, and the relation between the TIR and the risk of developing long term complications.
The purpose of this manuscript is also to emphasize on individualized treatment and the importance of rightful interventions according to the percentage TIR.
In conclusion, it has been seen that TIR is an excellent and an unusual metric for assessing patient’s individual glycemic variability and hence it is advisable that TIR be used in the national practice by our physicians, diabetologists and endocrinologists.
Background
The prevalence of diabetes has tripled over the past two decades from 151 million in 2000 to 463 million in 2020. As we are aware that diabetes is a chronic inflammatory condition causing multi-organ dysfunction in majority of the patients and since it is highly difficult to reverse diabetes in the major chunk of the affected population, the main goal in diabetic care is maintaining glucose levels as close to normal and thereby delaying the devastating long-term complications.
The ideal management of diabetes is multidisciplinary and is to be tailor made for every individual. It is majorly dependent on regular glucose monitoring, precise insulin dosing, or oral antidiabetic medication, and rational decision making by the treating doctor [1]. HbA1c has been considered as the gold standard for assessment of the glycemic variability after the release of the DCCT trial results in 1993 which is considered as a landmark in the history of diabetes.
For more than a quarter of a century, HbA1C has ruled the field of diagnosis of diabetes and it was recognized as a reliable and an indirect biomarker that reflects long-term average glucose control [2]. HbA1c does have some limitations, which we were aware of even way back in 1990, but they have come more under the lens in the recent years after the regular use of CGM in patients. HbA1c is considered to give an average blood glucose level that prevailed in the last 2-3 months in a patient but it fails to indicate glycemic variability (GV) i.e., daily glycemic excursions which may contribute to hypoglycemia and hyperglycemia which has been thought to be the reason for the development of microvascular and macrovascular complications in these patients [3]. There is substantial evidence that these glucose excursions beyond HbA1c are associated with the damage to susceptible organs and chromosomes, likely through oxidative stress [13-15], and are thought to be significant risk factors for impairment in the cognitive function and evolving brain structures in young children with type 1 diabetes during early course of the disease [1].
Also, certain conditions such as anemia, hemoglobinopathies, iron deficiency and pregnancy can act as confounding factors for HbA1C measurements [4]. Importantly, as reported by Beck et al [5], the HbA1C test can fail to accurately reflect the mean glucose levels even when none of those conditions are present. It has been seen that the utility of HbA1C is further enhanced when used as a complement to glycemic data measured by CGM.
To overcome these limitations International Consensus has come up with the guidelines for patients who are on Continuous Glucose Monitoring. Continuous Glucose Monitoring (CGM), either real-time (rtCGM) or intermittently scanned (isCGM), effectively addresses these barriers and provides a more comprehensive picture of glucose control than HbA1c. CGM devices provide a broad spectrum of additional glucose management metrics, including proportions of Time- In-Range (TIR), Time-Below-Range (TBR), Time-Above-Range (TAR), and glucose variability (GV) which can be used in individualizing the diabetes management and for making a real-time treatment modifications [1].
Continuous Glucose Monitoring
The use of CGM allows for the direct observation of glycemic excursions and daily profiles of blood glucose levels, which can guide the treating physicians in making immediate decision, both therapeutic and also with the required individual lifestyle modifications. CGM also provides the ability to assess glucose variability and identify patterns and duration of hypoglycemia and hyperglycemia which are thought to be the main cause of microvascular complications [4].
It is impractical to assess and fully utilize the continuous variable blood glucose levels measured throughout the day by CGM as metrics in the day-to-day clinical practices. To streamline the data interpretation, the consensus panel identified “time in ranges” as a metric of glycemic control that provides more reasonable information than HbA1C alone. The panel agreed that setting up target percentages of time in the various glycemic ranges with a specified percentage cut points will benefit the special diabetes populations (e.g., pregnancy, high-risk) which can also facilitate safe and effective therapeutic decision making within the parameters of the established glycemic goals. The consensus group agreed that expressing time in the various ranges can be done as the percentage (%) of CGM readings, average hours and minutes spent in each range per day, or both, depending on the circumstances.
The metric consists of three major CGM measurements which are – percentage of readings and the time in which the blood glucose are in the target range, termed as Target In Range (TIR), readings and time below the target specified are termed as Target Below Range (TBR), and the readings and the time above the predetermined readings will fall under Target Above Range (TAR) (Table 1).
Table 1. Standardized CGM metrics 2019
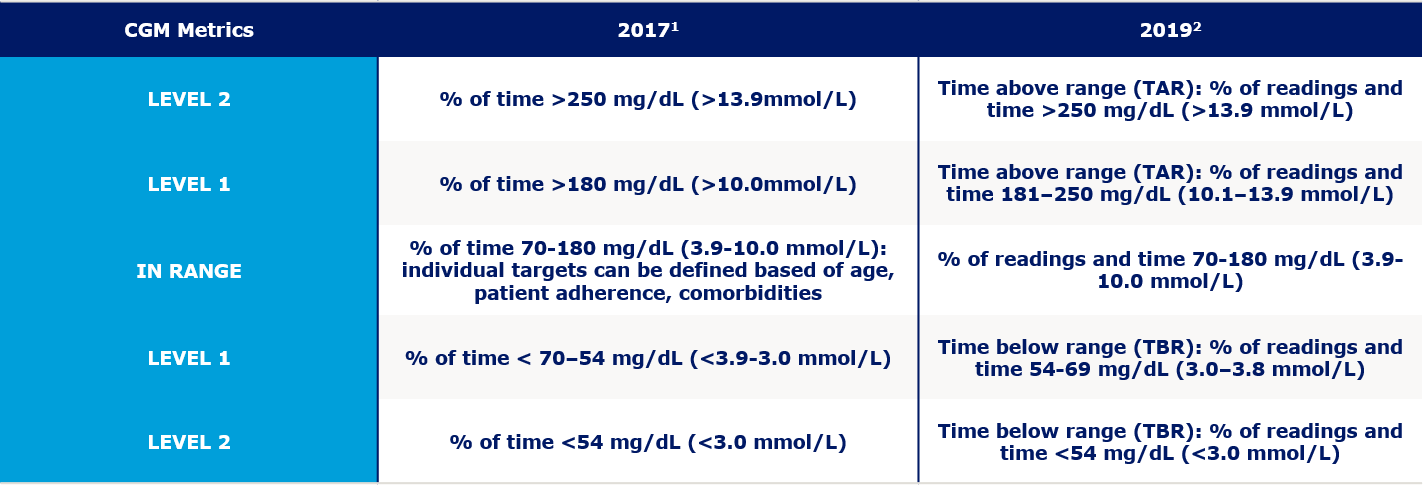
The primary goal for effective and safe glucose control is to increase the TIR while reducing the TBR [4]. Although the metric includes TIR, TBR, and TAR, achieving the goals for both TBR and TIR would result in reduced time spent above range and hence improving the glycemic control. However, some clinicians may choose to target the reduction of the high glucose values and minimize hypoglycemia, thereby arriving at more time in the target range. In both approaches, the first priority is to reduce TBR to target levels and then address TIR or the TAR targets.
The experts from all the diabetic organizations in the world reached a consensus on glycemic cut-points (a target range of 70-180 mg/dL [3.9-10.0 mmol/L] for individuals with type 1 diabetes and type 2 diabetes (Fig. 1) and in pregnancy a target range of 63-140 mg/dL (3.5- 7.8 mmol/L) (Fig. 2). It should be noted that premeal and postprandial SMBG targets have been retained for diabetes in pregnancy, in addition to the new CGM-TIR targets for overall glycemia.
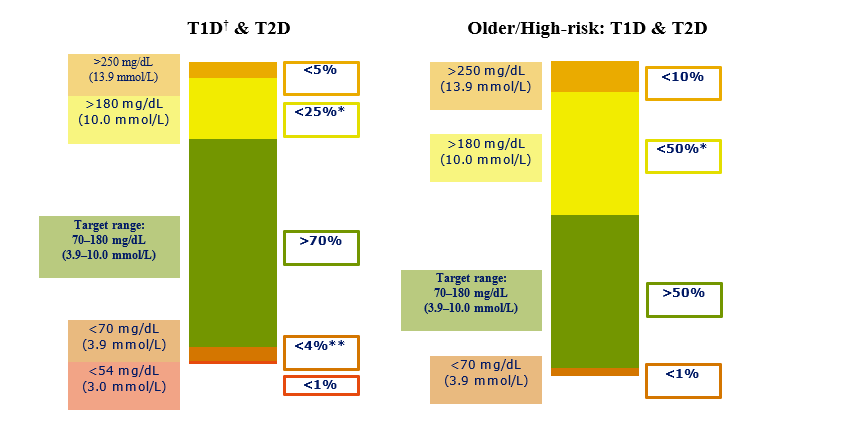
Fig 1. CGM based targets for different diabetes population.
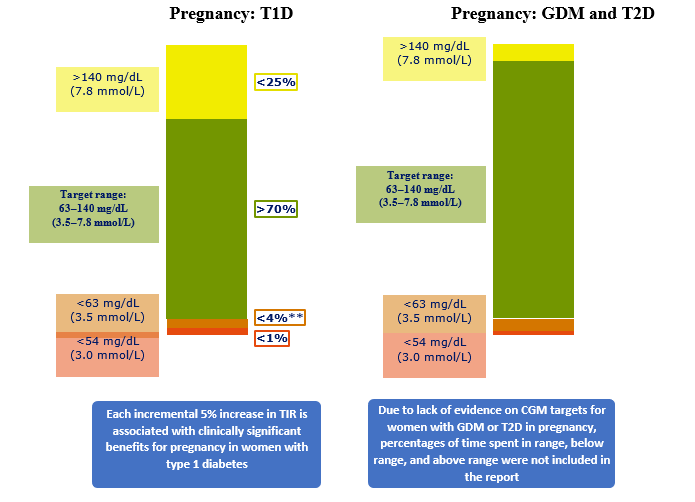
Fig. 2. CGM based targets for different diabetes population.
The recent studies have shown the potential of reaching these targets with CGM in individuals who are on multiple daily insulin injections [6]. In type 2 diabetes, there is generally less glycemic variability and hypoglycemia than in type 1 diabetes [7]. Thus, people with type 2 diabetes can often achieve more time in the target range while minimizing the hypoglycemia episodes [4]. As demonstrated by Beck et al [5], individuals with type 2 diabetes increased their TIR by 10.3% (from 55.6 to 61.3%) after 24 weeks of CGM use with slight reductions in TBR. In the recent times, the beneficial effects of new medications, such as sodium-glucose cotransporter 2 agents have helped individuals with type 1 diabetes increase TIR [8-10]. It was seen that the targets for type 1 diabetes and type 2 diabetes were close enough to combine into one set of targets, outside of pregnancy.
Although evidence regarding TIR for older and high-risk individuals is lacking, numerous studies have shown the elevated risk for hypoglycemia in these populations [11-16]. Hence the target has been lowered from 70 to 50% and reduced TBR to 1 at 70 mg/dL (3.9 mmol/L) to place a greater emphasis on reducing hypoglycemia with less emphasis on maintaining target glucose levels (Fig. 1).
Association with Complications
Diabetes is the leading cause of cardiovascular disease throughout the world and increased Carotid intima media thickness (CIMT) is one of the earliest finding in diabetes population with future cardiovascular complications. Jingyi Lu et al have shown in their study that TIR and CIMT are inversely related and every 10% increase in TIR resulted in 6.4% low risk of abnormal CIMT. Bergenstal et al presented data of DEVOTE trial in ADA conference in June 2020 which showed TIR is inversely proportional to MACE and results revealed that there was reduction of MACE by 27-30% for TIR of more than 70% compared to the population with TIR less than 50%. The IQVIA Core Diabetes Model was used to calculate the cumulative incidence of developing major diabetes-related complications over a 10-year time horizon in people with Type 1 and Type 2 diabetes. Currently available risk equations do not include TIR as a variable but have HbA1c. As HbA1c is a core input of the model, TIR values are required to be converted into HbA1c prior to being modelled. 10-year cumulative incidence refers to the percentage of patients having a complication over a ten-year period. Inclusion of TIR showed that population with 70% TIR and 80% TIR has better outcome over 58% TIR.
Associations between TIR and the progression of both diabetic retinopathy (DR) and development of microalbuminuria were reported by Beck et al [17]. Their analysis has shown that the hazard rate for retinopathy progression increased by 64% for each 10% reduction in TIR. And the hazard rate for the development of microalbuminuria increased by 40% for each 10% reduction in TIR.
Similar association was observed between DR and TIR in a recent study done by Lu et al [18], in which 3,262 patients were involved, and their results showed that individuals with more advanced DR spent significantly less time within target range (70-180 mg/dL; 3.9-10.0 mmol/L) and also that the prevalence of DR decreased with an increasing TIR percentage.
Association with HbA1C
An increase in TIR of 10% corresponds to a decrease in HbA1C of approximately 0.5%, similar associations were seen in an analysis of 18 randomized controlled trials (RCTs) by Vigersky and McMahon [19] that included over 2,500 individuals with type 1 diabetes and type 2 diabetes over a wide range of age and HbA1C levels.
Pregnancy
Because of the lack of evidence on CGM targets for women in patients of gestational diabetes mellitus (GDM) or in pregnant patients with type 2 diabetes, percentages of time spent in range, below range, and above range are not included in the guidelines released by the International Consensus (Fig. 2)
Older and High-Risk Individuals
In elderly diabetic patients and high-risk individuals with diabetes are at a significantly increased risk for severe hypoglycemia due to factors like age, longer duration of diabetes, improper timing of insulin therapy, and a greater prevalence of unawareness due to hyperglycemia [11-15]. High-risk individual includes patients with comorbid conditions (e.g., cognitive deficits, renal disease, joint disease, osteoporosis, previous fracture, and/or cardiovascular disease) and those requiring assisted care, which can complicate the desired treatment regimens [16]. Hence in these patients the consensus guidelines have strongly suggested to individualize the targets and the treatment regimen with a strong focus on reducing the percentage of time spent in hypoglycemia (70 mg/dl) and to reduce episodes of excessive hyperglycemia (Fig. 1).
Clinical Application of Time in Ranges
Despite having exceptional value, the clinical utilization of CGM data have remained suboptimal mainly due to resource poor settings, time constraints, inexperience in the data interpretation, lack of standardization software [20]. The current consensus guidelines have majorly overcome these barriers, hence enabling clinicians to readily identify important Time in Ranges metrics allowing for greater personalization of therapy through a shared decision making.
Conclusion
The usage of CGM has already been expanding in Indian clinical practice. CGM remains as a major component of diabetes self-management, providing immediate data on the current glucose levels to the patients, as well to the care provider and thus helping in the management. This information can help majority of the patients in optimizing the dietary intake, exercise, modifying the existing therapy and timing of the insulin and most importantly in taking an immediate action during an acute glycemic event and to further prevent such attacks in future [21-23]. Increasing TIR has shown to have reducing both microvascular and macrovascular complications in diabetes. As TIR provides a closer view of person’s glycemic status and aids in better glycemic management, TIR needs to be adopted in our regular clinical practice.
This review article concludes with emphasizing the importance of CGM and hence the concept of Time in ranges as an appropriate and useful metric to measure the outcomes in diabetic patients. The consensus report also highlights on the usage of the specified target values mentioned in this article and to utilize it in the day-to-day treatment and decision making.
Conflict of Interest
The authors of this article do not have any conflict of interest.
References
- Dovc K, Battelino T. Time in range centered diabetes care. Clin Pediatr Endocrinol. 2021;30(1):1-10.
- Beck RW, Bergenstal RM, Riddlesworth TD, et al. Validation of time in range as an outcome measure for diabetes clinical trials. Diabetes Care. 2019;42(3):400-5.
- Saboo B, Kesavadev J, Shankar A, et al. Time-in-range as a target in type 2 diabetes: An urgent need. Heliyon. 2021;7(1):e05967.
- Battelino T, Danne T, Bergenstal RM, et al. Clinical targets for continuous glucose monitoring data interpretation: recommendations from the international consensus on Time in Range. Diabetes Care. 2019;42(8):1593-603.
- Beck RW, Connor CG, Mullen DM, et al. The fallacy of average: how using HbA1c alone to assess glycemic control can be misleading. Diabetes Care 2017;40:994-9.
- Å oupal J, Petruželková L, Flekač M, et al. . Comparison of different treatment modalities for type 1 diabetes, including sensor-augmented insulin regimens, in 52 weeks of follow-up: a COMISAIR study. Diabetes Technol Ther. 2016;18:532-8.
- Rama Chandran S, Tay WL, Lye WK, et al. Beyond HbA1c: comparing glycemic variability and glycemic indices in predicting hypoglycemia in type 1 and type 2 diabetes. Diabetes Technol Ther. 2018;20:353-62.
- Famulla S, Pieber TR, Eilbracht J, et al. . Glucose exposure and variability with empagliflozin as adjunct to insulin in patients with type 1 diabetes: continuous glucose monitoring data from a 4-week, randomized, placebo-controlled trial (EASE-1). Diabetes Technol Ther. 2017;19:49-60.
- Dandona P, Mathieu C, Phillip M, et al. DEPICT-1 Investigators. Efficacy and safety of dapagliflozin in patients with inadequately controlled type 1 diabetes: the DEPICT-1 52-week study. Diabetes Care. 2018;41:2552-9.
- Mathieu C, Dandona P, Phillip M, et al. DEPICT-1 and DEPICT-2 Investigators. Glucose variables in type 1 diabetes studies with dapagliflozin: pooled analysis of continuous glucose monitoring data from DEPICT-1 and -2. Diabetes Care 2019;42:1081-7.
- Weinstock RS, DuBose SN, Bergenstal RM, et al. T1D Exchange Severe Hypoglycemia in older adults with type 1 Diabetes Study Group. Risk factors associated with severe hypoglycemia in older adults with type 1 diabetes. Diabetes Care. 2016;39:603-10.
- Bremer JP, Jauch-Chara K, Hallschmid M, et al. Hypoglycemia unawareness in older compared with middle-aged patients with type 2 diabetes. Diabetes Care. 2009;32:1513-7.
- Punthakee Z, Miller ME, Launer LJ, et al. ACCORD Group of Investigators; ACCORD-MIND Investigators. Poor cognitive function and risk of severe hypoglycemia in type 2 diabetes: post hoc epidemiologic analysis of the ACCORD trial. Diabetes Care. 2012;35:787-93.
- Giorda CB, Ozzello A, Gentile S, et al. HYPOS-1 Study Group of AMD . Incidence and risk factors for severe and symptomatic hypoglycemia in type 1 diabetes. Results of the HYPOS-1 study. Acta Diabetol. 2015;52:845-53.
- Cariou B, Fontaine P, Eschwege E, et al. Frequency and predictors of confirmed hypoglycaemia in type 1 and insulin-treated type 2 diabetes mellitus patients in a real-life setting: results from the DIALOG study. Diabetes Metabol. 2015;41:116-25.
- Abdelhafiz AH, Rodríguez-Maí±as L, Morley JE, et al. Hypoglycemia in older people – a less well recognized risk factor for frailty. Aging Dis. 2015;6:156-67.
- Beck RW, Bergenstal RM, Riddlesworth TD, et al. Validation of time in range as an outcome measure for diabetes clinical trials. Diabetes Care 2019;42:400-5.
- Lu J, Ma X, Zhou J, et al. Association of time in range, as assessed by continuous glucose monitoring, with diabetic retinopathy in type 2 diabetes. Diabetes Care. 2018;41:2370-6.
- Vigersky RA, McMahon C. The relationship of hemoglobin A1C to time-in-range in patients with diabetes. Diabetes Technol Ther. 2019;21:81-5.
- Rodbard D. Continuous glucose monitoring: a review of successes, challenges, and opportunities. Diabetes Technol Ther. 2016;18(Suppl. 2):S3-S13.
- Aleppo G, Laffel LM, Ahmann AJ, et al. A practical approach to using trend arrows on the Dexcom G5 CGM system for the management of adults with diabetes. J Endocr Soc. 2017;1:1445-60.
- Laffel LM, Aleppo G, Buckingham BA, et al. A practical approach to using trend arrows on the Dexcom G5 CGM system to manage children and adolescents with diabetes. J Endocr Soc. 2017;1:1461-76.
- Kudva YC, Ahmann AJ, Bergenstal RM, et al. Approach to using trend arrows in the FreeStyle Libre Flash Glucose Monitoring Systems in adults. J Endocr Soc. 2018;2:1320-37.

M. Ravikeerthy
Director Internal Medicine

KM. Hamsa
Registrar Internal Medicine