DNB Thesis
Significance of waist to height ratio as an early predictor in developing metabolic syndrome in children of age group 5-12 years in a tertiary care centre in Trichy: Part II
Dissertation Submitted to the National Board of Examinations, New Delhi
Dr. Nimisha PV*
Department of Pediatrics, KMC Speciality Hospital, Trichy, Tamil Nadu
*Correspondence: n4nimmi92@gmail.com
Aim
- To study the significance of waist to height ratio as an early predictor in children prone to developing metabolic syndrome, in the age group 5-12 years, in a tertiary care centre in Trichy.
Objectives
- To identify the cut off value of waist to height ratio, above which intervention is needed.
- To compare the association of metabolic syndrome with BMI and Waist to height ratio.
Materials and Methods
Study design
Cross sectional study
Study setting
Kauvery Speciality Hospital, a private tertiary care centre in Trichy
Study duration
A total period of 24 months from January 2019 to December 2020.
Sample size: 170
| Sample size for frequency in a population | ||
| Population size(N): | 750 | |
| Proportion (p): | 84% | |
| Confidence limits as %(d): | 5% | |
| Design effect (DEFF): | 1 | |
| Sample Size(n) | ||
| Confidence Level (%)- 95% | Sample Size- 170 | |
Equation
Sample size n = [DEFF*Np(1-p)]/ [(d2/Z21-α/2*(N-1)+p*(1-p)]
(OR)
where,
n = Sample Size
Deff = Design Effect
N= Population Size
p̂ = the estimated proportion of the population
q̂= 1-p̂
d = desired absolute precision (or) absolute level of precision
Statistical analysis
Statistical analysis was performed using SPSS, (Version 20.0). The continuous variables are expressed as Mean and Standard deviation. Categorical variables are expressed as frequency and percentage. Independent ‘t’-test is used to find the significance difference between groups. Chi- square test and Fisher’s exact test are used to find out association between the categorical variables. P<0.05 is considered as statistically significant.
The diagnostic yield of the study was calculated by the following variables.
Reference
| TP | True Positive |
| TN | True Negative |
| PPV | Positive Predictive Value |
| NPV | Negative Predictive Value |
(1). Sensitivity: Sensitivity or true positive rate is a conditional probability of correctly identifying a diseased subject, given by the formula
Sensitivity = TP/(TP + FN)
(2). Specificity: Specificity or true negative rate is a conditional probability of correctly identifying the non- diseased subjects, given by
Specificity = TN/(TN + FP)
(3). Positive predictive value: It is the probability that subjects with a positive screening test truly have the disease, given by
PPV =TP/(TP + FP)
(4). Negative predictive value: It is the probability that subjects with a negative screening test truly don’t have the disease, given by
NPV = TN/(TN + FN)
(5). Accuracy: In simple terms, given a set of points from repeated measurements of the same quantity, the set can be said to be accurate if their average is close to the true value of the quantity being measured.
Accuracy = (TN + TP)/(TP + FP + TN + FN)
Inclusion Criteria
- Overweight and obese children in the age group 5 years to 12 years from both OP and IP department according to the current definition.
Exclusion Criteria
- Syndromes that may cause obesity.
- Children with endocrine abnormalities.
METHODOLOGY
Measure Weight / height / BMI / Waist circumference of children of this age group
Identifying the children who fall in over weight / obese category
Applying exclusion criteria
Proceed with BP measurement and check Fasting blood sugar, Fasting lipid profile.
A detailed physical examination was done to rule out any systemic disorder. Waist circumference measurement was taken from the midway between iliac crest and costal margin using inch tape. Height was taken following the accepted method using stadiometer. Blood samples were collected in fasting state in heparinized glass tubes. These were processed almost immediately, for further evaluation of total cholesterol (TC), serum triglycerides (TG), High density lipoprotein cholesterol (HDL-C) by using specific enzymatic methods. LDL by direct calculation and FBS done by hexokinase method.
A total of 188 children met inclusion criteria in which 12 children’s parents were not willing for blood investigations, 4 were hypothyroid and 2 were syndromic. Excluding them, total of 170 sample were collected. Data was then analysed.
Operational definitions of study variables
Metabolic syndrome is defined as the presence of any 3 or more of the following according to their age related values.
- Elevated fasting blood sugar (> 100mg/dL)
- High Blood pressure (systolic/diastolic) (> 90th centile for age).
- Elevated fasting triglycerides (age specific cut-off values)
- Low HDL (< 35mg/dL)
- Abdominal adiposity (WC > 90th centile)
All the reference values taken from previous studies. BMI was calculated and plotted in IAP growth chart. Waist circumference to height ratio centile chart for south Indian children was referred from the previous study.19 Age specific reference values for blood lipids were taken from International journal of obesity.32 BP centiles were taken from previous data of BP distribution in Indian children.20 Systolic or diastolic BP more than 90th centile was taken as high BP.
Results
A total of 11,401 children got admitted/ had out-patient visit during the study period, of which 188 met inclusion criteria. 12 parents were not willing for blood investigations and 4 children were excluded by applying exclusion criteria. 170 children were then recruited for the study.
Table 1. Gender
| Gender | % | |
| Male | 92 | 54.1 |
| Female | 78 | 45.9 |
| Total | 170 | 100.0 |
As shown in the Table 1, 54 % were boys. The mean age of study participants was 8.78 + 2.2. Participants were either obese or overweight according to the current IAP BMI definition. Blood investigations were conducted in all.
Table 2. Age vs Gender comparison (%)
| Age Variables
(years) |
Gender | Total | % | |||
| Male | % | Female | % | |||
| 5 – 7 | 16 | 17.4% | 35 | 44.9% | 51 | 30.0% |
| 8 – 10 | 48 | 52.2% | 25 | 32.1% | 73 | 42.9% |
| > 10 | 28 | 30.4% | 18 | 23.1% | 46 | 27.1% |
| Over All | 92 | 78 | 170 | |||
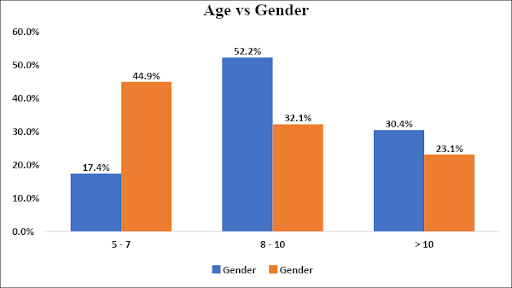
Fig. 1. Age vs Gender
Sample population contained more children in the age group 8-10 years. In girls, 44.9% of the girls in the study population were in the 5-7 years age group. Total of 77.2% of the boys were obese according to IAP definition (>27th adult equivalent) and 22.8% were overweight (>23rd equivalent). Among girls, 66.7% were obese and 33.3% were overweight. Of the 170, 123 children were obese and 47 were overweight as per current IAP definition.
Table 3: BMI vs Gender (%)
| BMI | Gender | Total | % | p Value | |||
| Male | % | Female | % | ||||
| OBESE | 71 | 77.2% | 52 | 66.7% | 123 | 72.4% | χ2= 0.127 |
| OVERWEIGHT | 21 | 22.8% | 26 | 33.3% | 47 | 27.6% | |
| Over All | 92 | 78 | 170 | ||||
Table 3 shows that 77.2% of boys and 66.7 % of girls were obese. No significant correlation between gender and BMI was identified.
All the 5 variables namely FBS, HDL, WC, BP, TG were compared in obese and overweight children recruited. Additional variable LDL was also compared in the study group. Later comparison was made to identify association of these parameters to waist to height ratio above and below 95th centile, according to the age. All 170 children had age specific waist circumference more than 90th centile. 150 had a waist circumference to height ratio of more than 95th centile.
Table 4: Descriptive Statistics – Sample Size 170
| Parameter | Minimum | Maximum | Mean ± Std.Dev |
| AGE | 5 | 12 | 8.78 ± 2.25 |
| HEIGHT | 103 | 164 | 133.52 ± 14.30 |
| WEIGHT | 21.0 | 82.0 | 40.23 ± 12.81 |
| WC | 60 | 100 | 77.04 ± 9.47 |
| BMI | 15.61 | 30.49 | 21.93 ± 3.02 |
| WC/HT | .49 | .69 | 0.57 ± 0.03 |
| SBP | 80 | 130 | 106.46 ± 11.82 |
| DBP | 50 | 88 | 70.07 ± 9.07 |
| FBS | 65 | 134 | 92.19 ± 15.10 |
| HDL | 20 | 65 | 39.87 ± 8.51 |
| LDL | 27 | 156 | 90.04 ± 18.42 |
| TRIGLYCERIDES | 45 | 457 | 145.53 ± 47.76 |
Table 4 shows the general characteristics of the study population of 170.
COMPARISON BETWEEN BMI AND 5 VARIABLES STUDIED
Table 5a. BP vs BMI
| Variables | BMI | Total | % | p Value | ||||
| obese | % | overweight | % | |||||
| BP | High | 44 | 35.8% | 13 | 27.7% | 57 | 33.5% | χ2= 0.316 |
| Normal | 79 | 64.2% | 34 | 66.5% | 113 | 66.5% | ||
| Over All | 123 | 47 | 170 | |||||
Table 5a shows 35.8 % children with high BP for age were obese as per BMI classification, 27.7 % were overweight. The association was not statistically significant.
Table 5b. TG vs BMI
| Variables | BMI | Total | % | p Value | ||||
| obese | % | overweight | % | |||||
| TG | High | 109 | 88.6% | 38 | 80.9% | 147 | 86.5% | χ2= 0.185 |
| Normal | 14 | 11.4% | 9 | 19.1% | 23 | 13.5% | ||
| Over All | 123 | 47 | 170 | |||||
147 (86.5%) children had abnormal triglycerides, of which 38 were overweight. No significant association was found as seen in table 5 b.
Table 5c. HDL vs BMI
| Variables | BMI | Total | % | p Value | ||||
| obese | % | overweight | % | |||||
| HDL | Normal | 56 | 45.5% | 27 | 57.4% | 83 | 48.8% | χ2= 0.164 |
| Low | 67 | 54.5% | 20 | 42.6% | 87 | 51.2% | ||
| Over All | 123 | 47 | 170 | |||||
Table 5c. shows that half the children from the study population had low HDL. 56 children were obese and rest were in the overweight category.
Table 5d. LDL vs BMI
| Variables | BMI | Total | % | p Value | ||||
| obese | % | overweight | % | |||||
| LDL | Normal | 87 | 70.7% | 37 | 78.7% | 124 | 72.9% | χ2= 0.294 |
| High | 36 | 29.3% | 10 | 21.3% | 46 | 27.1% | ||
| Over All | 123 | 47 | 170 | |||||
Table 5d. shows no significant correlation of LDL cholesterol value and BMI. 72.9% children had normal LDL level.
Table 5e. FBS vs BMI
| Variables | BMI | Total | % | p Value | ||||
| Obese | % | Overweight | % | |||||
| FBS | Normal | 83 | 67.5% | 37 | 78.7% | 120 | 70.6% | χ2= 0.150 |
| High | 40 | 32.5% | 10 | 21.3% | 50 | 29.4% | ||
| Over All | 123 | 47 | 170 | |||||
As seen in table 5.e, 120 children had abnormal FBS value which constitutes around 70.6% of study population. Among them 83 were obese and 37 were overweight.
All the biochemical parameters and BP were then compared to the WHtR Centile. Reference values for WHtR was taken from previous studies done in Indian children.19 Cut off value of 95th centile was taken and its significance was compared with metabolic parameters. Of the 170 children, 150 had waist to height ratio more than 95th centile. The results are shown in the following tables.
Table 6a. BP vs WHtR Centile
| BP | WHtR Centile | Total | % | p Value | |||
| < 95th | % | > 95th | % | ||||
| Yes | 7 | 35.0% | 50 | 33.3% | 57 | 33.5% | χ2= 0.882 |
| No | 13 | 65.0% | 100 | 66.7% | 113 | 66.5% | |
| Over All | 20 | 150 | 170 | ||||
57 children had high BP for age in the study group. As seen in Table 6a, WHtR was more than 95th centile in 50 of them. However, there was no statistical significance.
Table 6b. TG vs WHtR Centile
| TG | WHtR Centile | Total | % | p Value | |||
| < 95th | % | > 95th | % | ||||
| High | 15 | 75.0% | 132 | 88.0% | 147 | 86.5% | χ2= 0.241 |
| Normal | 5 | 25.0% | 18 | 12.0% | 23 | 13.5% | |
| Over All | 20 | 150 | 170 | ||||
As seen in Table 6b, 88% children with WHtR > 95th centile had abnormal triglycerides in the serum, but is not significant as the p value is more than 0.05.
Table 6c. HDL vs WHtR Centile
| HDL | WHtR Centile | Total | % | p Value | |||
| < 95th | % | > 95th | % | ||||
| Normal | 12 | 60.0% | 71 | 47.3% | 83 | 48.8% | χ2= 0.287 |
| Low | 8 | 40.0% | 79 | 52.7% | 87 | 51.2% | |
| Over All | 20 | 150 | 170 | ||||
As shown in the table 6.c, 79 out of 87 children with high WHtR centile had abnormally low HDL cholesterol. 8 children with WHtR <95th centile also had low HDL. There was no statistical significance.
Table 6d. LDL vs WHtR Centile
| LDL | WHtR Centile | Total | % | p Value | |||
| < 95th | % | > 95th | % | ||||
| Normal | 14 | 70.0% | 110 | 73.3% | 124 | 72.9% | χ2= 0.127 |
| High | 6 | 30.0% | 40 | 26.7% | 46 | 27.1% | |
| Over All | 20 | 150 | 170 | ||||
Table 6d shows that 110 children with normal LDL cholesterol level had high waist to height ratio. But the association was not significant.
Table 6e. FBS vs WHtR Centile
| FBS | WHtR Centile | Total | % | p Value | |||
| < 95th | % | > 95th | % | ||||
| Normal | 14 | 70.0% | 106 | 70.7% | 120 | 70.6% | χ2=0.951 |
| High | 6 | 30.0% | 44 | 29.3% | 50 | 29.4% | |
| Over All | 20 | 150 | 170 | ||||
Out of the 50 children with high FBS, 95% children had a high waist to height ratio. 106 children with normal FBS also had high waist to height ratio. Table 6e shows no significant association.
In summary, among the study group 29.4% children had high FBS, 86% children had high triglycerides, 51.2% had low HDL, 27.1% had high LDL and 33.5% children had high BP.
Table 7. MetS in comparison with BMI
| BMI | MetS | Total | % | p Value | |||
| Yes | % | No | % | ||||
| Obese | 56 | 80.0% | 67 | 67.0% | 123 | 72.4% | χ2= 0.062 |
| Overweight | 14 | 20.0% | 33 | 33.0% | 47 | 27.6% | |
| Over All | 70 | 100 | 170 | ||||
By applying the described criteria for diagnosing MetS, out of 170 children studied ,70 children satisfied the criteria for metabolic syndrome. Only 56 children with metabolic syndrome had BMI more than 27th adult equivalent. 14 children had BMI in the overweight range.
Table 7 shows BMI classification identified 80% children with metabolic syndrome. 20% children with BMI in less than obese centile had features of MetS.This association was not statistically significant.
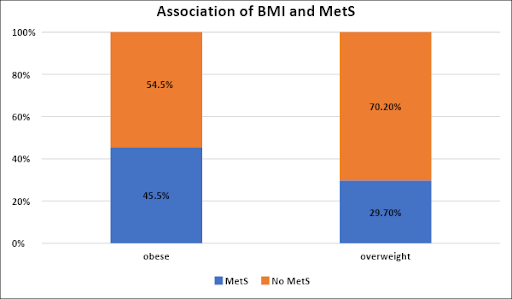
Fig. 2. Association of BMI and MetS
Fig. 2 shows that, 45% of obese and 30% of overweight children had MetS.
Table 8. MetS in comparison with WHtR Centile
| MetS | WHtR Centile | Total | % | p Value | ||||||
| < 95th | % | > 95th | % | |||||||
| Yes | 1 | 5.0% | 69 | 46.0% | 70 | 41.2% | χ2=0.000 | |||
| No | 19 | 95.0% | 81 | 54.0% | 100 | 58.8% | ||||
| Over All | 20 | 150 | 170 | |||||||
In the 70 children with metabolic syndrome 98.5% had waist to height ratio more than 95th centile and there was significant association between these two parameters, p value 0.00, as seen in table 8. Only 1 child with Waist to height ratio less than 95th centile had MetS.
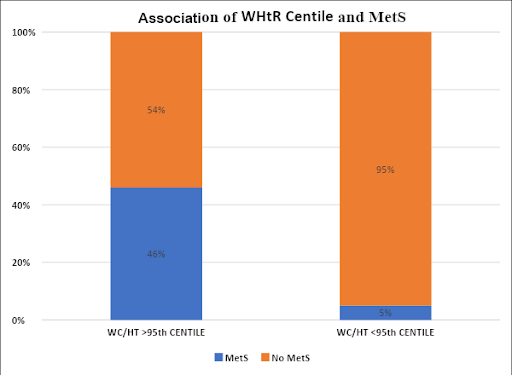
Fig. 3. Association of WHtR Centile and MetS
Fig 3 shows that MetS was found in 46% of those children who had a high waist to height ratio, as against 5% in those whose waist to height ratio was less than 95th centile.
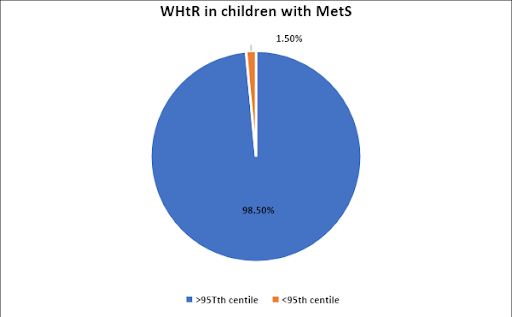
Fig. 4. WHtR Centile in children with MetS
Fig 4 shows that, out of 70 children with MetS, 69 had waist to height ratio more than 95th centile for their age, which is statistically significant.
With the above data, statistical analysis was done. Sensitivity, specificity, positive predictive value, negative predictive value of both BMI chart and WHtR chart were calculated. To recap the following statistical method was used.
Statistical Methods
The diagnostic yield of the study was calculated by the following variables.
Reference
| TP | True Positive |
| TN | True Negative |
| PPV | Positive Predictive Value |
| NPV | Negative Predictive Value |
(1). Sensitivity: Sensitivity or true positive rate is a conditional probability of correctly identifying a diseased subject, given by the formula
Sensitivity = TP/(TP + FN)
(2). Specificity: Specificity or true negative rate is a conditional probability of correctly identifying the non- diseased subjects, given by
Specificity = TN/(TN + FP)
(3). Positive predictive value: It is the probability that subjects with a positive screening test truly have the disease, given by
PPV =TP/(TP + FP)
(4). Negative predictive value: It is the probability that subjects with a negative screening test truly don’t have the disease, given by
NPV = TN/(TN + FN)
(5). Accuracy: In simple terms, given a set of points from repeated measurements of the same quantity, the set can be said to be accurate if their average is close to the true value of the quantity being measured.
Accuracy = (TN + TP)/(TP + FP + TN + FN)
Table 9. BMI vs MetS
| BMI vs MetS | |
| Parameter | Estimate % |
| Sensitivity | 80.0% |
| Specificity | 33.0% |
| Positive predictive value | 45.5% |
| Negative predictive value | 70.2% |
| Diagnostic accuracy | 52% |
Table 10. WHtR Centile vs MetS
| METS vs WHtR Centile | |
| Parameter | Estimate % |
| Sensitivity | 46.0% |
| Specificity | 95.0% |
| Positive predictive value | 98.6% |
| Negative predictive value | 19.0% |
| Diagnostic Accuracy | 52% |
From Tables 9 and 10 we came to the conclusion that waist to height ratio more than 95th centile had 95% specificity and 98.6% positive predictive value. Diagnostic accuracy was comparable to that of BMI.
Table 11. Descriptive statistics of 70 children with METS
| Parameter | Minimum | Maximum | Mean ± Std.Dev |
| AGE | 5 | 12 | 9.9 ± 1.95 |
| HEIGHT | 113 | 164 | 140.14 ± 13.04 |
| WEIGHT | 23 | 82 | 46.63 ± 12.68 |
| WC | 60 | 100 | 82.6 ± 8.40 |
| BMI | 17 | 30 | 23.21 ± 2.81 |
| WC/HT | 0.53 | 0.68 | 0.59 ± 0.03 |
| SBP | 90 | 130 | 113.11 ± 11.30 |
| DBP | 60 | 88 | 75.28 ± 8.39 |
| FBS | 65 | 134 | 100.52 ± 15.38 |
| HDL | 20 | 56 | 36.42 ± 7.25 |
| LDL | 65 | 156 | 99.28 ± 19.96 |
| TRIGLYCERIDES | 67 | 256 | 150.58 ± 39.74 |
Table 11 shows the descriptive variables in children with metabolic syndrome.
Following tables are used to highlight the association between 5 variables studied with BMI and WHtR among the 70 detected to have MetS.
Table 12a. Association of FBS with BMI in those with MetS
| FBS | Obese BMI | Total | % | p Value | |||
| Yes | % | No | % | ||||
| Normal | 22 | 39.30% | 9 | 64.30% | 31 | 44.30% | χ2= 0.092 |
| High | 34 | 60.70% | 5 | 35.70% | 39 | 55.70% | |
| Over All | 56 | 14 | 70 | ||||
Table 12a shows total of 34 children out of 56 with obese BMI and MetS had high FBS. Five children with overweight BMI also had high FBS showing no statistical correlation.
Table 12b. Association of FBS with WHtR Centile in those with MetS
| FBS | WHtR Centile | Total | % | p Value | |||
| < 95th | % | > 95th | % | ||||
| Normal | 1 | 100.0% | 30 | 43.5% | 31 | 44.3% | χ2=0.259 |
| High | 0 | 0.0% | 39 | 56.5% | 39 | 55.7% | |
| Over All | 1 | 69 | 70 | ||||
As seen in table 12b, fasting blood sugar was high in 56% and normal in 44% among those with a high WHtR and MetS.
Table 13a. Association of BP with BMI in those with MetS
| BP | Obese BMI | Total | % | p Value | |||
| Yes | % | No | % | ||||
| High | 37 | 66.10% | 8 | 57.10% | 45 | 64.30% | χ2= 0.533 |
| Normal | 19 | 33.90% | 6 | 42.90% | 25 | 35.70% | |
| Over All | 56 | 14 | 70 | ||||
Table 13b. Association of BP with WHtR in those with MetS
| BP | WHtR Centile | Total | % | p Value | |||
| < 95th | % | > 95th | % | ||||
| Yes | 1 | 100.0% | 44 | 63.8% | 45 | 64.3% | χ2= 0.453 |
| No | 0 | 0.0% | 25 | 36.2% | 25 | 35.7% | |
| Over All | 1 | 69 | 70 | ||||
Tables 13 a and b shows no significant association between metabolic syndrome and BP as a single parameter.
Table 14a. Association of HDL with BMI in those with MetS
| HDL | Obese BMI | Total | % | p Value | |||
| Yes | % | No | % | ||||
| Normal | 14 | 25.00% | 4 | 28.60% | 18 | 25.70% | χ2= 0.784 |
| Low | 42 | 75.00% | 10 | 71.40% | 52 | 74.30% | |
| Over All | 56 | 14 | 70 | ||||
Table 14b. Association of HDL with WHtR in those with MetS
| HDL | WHtR Centile | Total | % | p Value | |||
| < 95th | % | > 95th | % | ||||
| Normal | 1 | 100.0% | 17 | 24.6% | 18 | 25.7% | χ2= 0.087 |
| Low | 0 | 0.0% | 52 | 75.4% | 52 | 74.3% | |
| Over All | 1 | 69 | 70 | ||||
p value for the association of HDL as seen in the Table 14a and b were 0.7, 0.08 respectively, thus showing no statistical significance between serum HDL and MetS.
Table 15a. Association of LDL with BMI and WHtR in those with MetS
| LDL | Obese BMI | Total | % | p Value | |||
| Yes | % | No | % | ||||
| Normal | 26 | 46.40% | 7 | 50.00% | 33 | 47.10% | χ2= 0.811 |
| High | 30 | 53.60% | 7 | 50.00% | 37 | 52.90% | |
| Over All | 56 | 14 | 70 | ||||
Table 15b. Association of LDL with WHtR in those with MetS
| LDL | WHtR Centile | Total | % | p Value | |||
| < 95th | % | > 95th | % | ||||
| Normal | 0 | 0.0% | 33 | 47.8% | 33 | 47.1% | χ2= 0.341 |
| High | 1 | 100.0% | 36 | 52.2% | 37 | 52.9% | |
| Over All | 1 | 69 | 70 | ||||
Table 15 a and b show no significant association seen in children with MetS and their LDL values against BMI centile and WHtR.
Table 16a. Association of Triglycerides with BMI in those with MetS
| TG | Obese BMI | Total | % | p Value | |||
| Yes | % | No | % | ||||
| High | 53 | 94.60% | 14 | 100.00% | 67 | 95.70% | χ2= 0.376 |
| Normal | 3 | 5.40% | 0 | 0.00% | 3 | 4.30% | |
| Over All | 56 | 14 | 70 | ||||
Above Table 16a shows no association with BMI centiles to children with MetS.
Table 16b. Association of Triglycerides with WHtR in those with MetS
| TG | WHtR Centile | Total | % | p Value | |||
| < 95th | % | > 95th | % | ||||
| High | 0 | 0.0% | 67 | 97.1% | 67 | 95.7% | χ2= 0.000 |
| Normal | 1 | 100.0% | 2 | 2.9% | 3 | 4.3% | |
| Over All | 1 | 69 | 70 | ||||
On comparing WHtR and TG value as shown in Table 16b, p value was found to be 0.00 (<0.05), which denotes significant association.
Table 17 Association of Gender and MetS
| Gender | MetS | Total | % | p Value | |||
| Yes | % | No | % | ||||
| Male | 42 | 60.0% | 50 | 50.0% | 92 | 54.1% | χ2= 0.198 |
| Female | 28 | 40.0% | 50 | 50.0% | 78 | 45.9% | |
| Over All | 70 | 100 | 170 | ||||
Table 17 shows no significant association of MetS and gender.
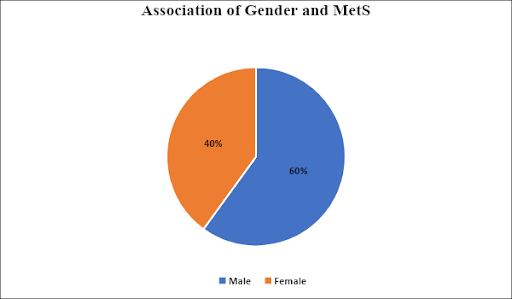
Fig. 5. Association of Gender and MetS.
Table 17 and Fig. 5 show no significant association between gender and MetS. As shown in Fig. 5, in the 70 children with MetS, 60% are boys, 40% are girls.
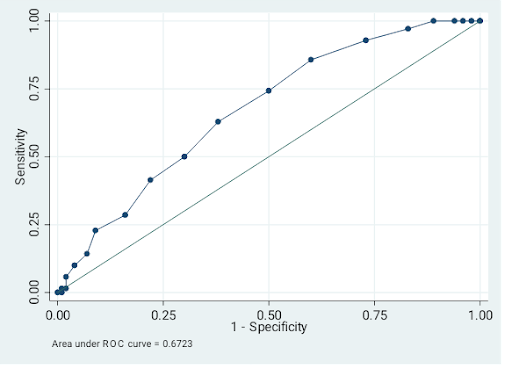
With the above results ROC curve was plotted.
Table 18. Detailed report of sensitivity and specificity
| Cut off point | Sensitivity (%) | Specificity (%) | Classified (%) | LR+ | LR- |
| (≥ .49 ) | 100.00 | 0.00 | 41.18 | 1.0000 | |
| (≥ .5 ) | 100.00 | 2.00 | 42.35 | 1.0204 | 0.0000 |
| (≥ .51 ) | 100.00 | 4.00 | 43.53 | 1.0417 | 0.0000 |
| (≥ .52 ) | 100.00 | 6.00 | 44.71 | 1.0638 | 0.0000 |
| (≥ .53 ) | 100.00 | 11.00 | 47.65 | 1.1236 | 0.0000 |
| (≥ .54 ) | 97.14 | 17.00 | 50.00 | 1.1704 | 0.1681 |
| (≥ .55 ) | 92.86 | 27.00 | 54.12 | 1.2720 | 0.2646 |
| (≥ .56 ) | 85.71 | 40.00 | 58.82 | 1.4286 | 0.3571 |
| (≥ .57 ) | 74.29 | 50.00 | 60.00 | 1.4857 | 0.5143 |
| (≥ .58 ) | 62.86 | 62.00 | 62.35 | 1.6541 | 0.5991 |
| (≥ .59 ) | 50.00 | 70.00 | 61.76 | 1.6667 | 0.7143 |
| (≥ .6 ) | 41.43 | 78.00 | 62.94 | 1.8831 | 0.7509 |
| (≥ .61 ) | 28.57 | 84.00 | 61.18 | 1.7857 | 0.8503 |
| (≥ .62 ) | 22.86 | 91.00 | 62.94 | 2.5397 | 0.8477 |
| (≥ .63 ) | 14.29 | 93.00 | 60.59 | 2.0408 | 0.9217 |
| (≥ .64 ) | 10.00 | 96.00 | 60.59 | 2.5000 | 0.9375 |
| (≥ .65 ) | 5.71 | 98.00 | 60.00 | 2.8571 | 0.9621 |
| (≥ .66 ) | 1.43 | 98.00 | 58.24 | 0.7143 | 1.0058 |
| (≥ .68 ) | 1.43 | 99.00 | 58.82 | 1.4286 | 0.9957 |
| (≥ .69 ) | 0.00 | 99.00 | 58.24 | 0.0000 | 1.0101 |
| ( > .69 ) | 0.00 | 100.00 | 58.82 | 1.0000 |
Fig. 6. ROC CURVE

Dr. Nimisha PV
DNB PG