Retrospective study of patient characteristics of recovered patients from moderate to severe COVID versus patients who succumbed to COVID-19
Reshma Raju, G Dominic Rodriguez*, Ivan A Jones, Stephy George
Department of General Medicine, Kauvery Hospital, Trichy, India
*Corresondence: domappa1966@gmail.com
Abstract
Background: The novel coronavirus 2019 which caused the COVID-19 pandemic in the year 2020 and affected every country in the world has left behind a great deal of economic and social loss as well as loss of human lives. Several factors were responsible for the severity and mortality of COVID-19 disease. In this study, we retrospectively analysed a group of patients who had moderate and severe COVID-19 and the factors which influenced their survival or death. We also looked at any treatments which mattered.
Methods: This is a retrospective observational study of 120 patients who were admitted with moderate or severe covid in Kauvery Hospital, Trichy during a period of 6 months from July 2020 to December 2020.The characteristics of the patients including comorbidities, duration of hospital stay, day of illness at presentation and treatment given were taken from the medical records. Data was entered into Microsoft Excel and analysed.
Results: Among 120 patients, 31 patients were 50 years of age. Out of them, 71% survived and 31% did not. 62 patients were hypertensive out of which 46.8% survived and 53.2% did not. 13 patients had CKD, out of which 15.4% survived and 84.6% did not. 96 patients presented within 7 days of onset of illness, out of which 61.5% survived and 38.5% did not. 58 patients received NIV support, out of which 15.5% survived and 84.5% did not.
Keywords: COVID-19, Comorbidities, HFNO, CAD, CKD
Background
Coronaviruses are beta coronaviruess that constitute the subfamily Orthocoronaviridae, and family Coronaviridae. Person-to-person transmission has been identified through respiratory droplets or close contact [1-3]. The main clinical manifestations are fever, dry cough and shortness of breath. Gastrointestinal symptoms and liver damage may also be observed in some cases [4,5]. Patients could also develop the symptoms of anosmia and ageusia. Severe patients might progress to dyspnoea and even acute respiratory distress syndrome (ARDS), immunological derangement, coagulopathy, septic shock and MODS [6]. It was found that factors such as high viral load, comorbidities such as hypertension, diabetes mellitus, acute respiratory distress syndrome (ARDS), cardiovascular disease, cancer, COPD, asthma, renal disease, kidney disease, hepatic disease, pneumonia, obesity, and history of smoking, could be responsible for the development of severe disease and death [7,8]. This study was to retrospectively analyse the characteristics of these patients and compare the differences between patients who survived or died and look at clinical characteristics that separated the two groups and any treatment approaches that mattered.
Methods
This was a retrospective analysis of patients admitted for Covid care at Kaveri Medical Centre and Hospital, Tennur who was diagnosed with moderate to severe COVID-19 at presentation, from July 2020 to December 2020. All data were collected from the medical records of patients diagnosed with COVID-19. From the patients diagnosed with COVID-19, moderate and severe cases were selected.
Then two groups were formed
The survivor group (SG)
The Non survivor group (NSG)
The patient characteristics between the survivor group and non-survivor group were compared.
Statistical analysis was performed using SPSS, (Version 20.0).
Results
Among 120 patients, 31 patients were 50 years of age. Out of them 71% survived and 31% did not survive. 62 patients were hypertensive out of which 46.8% survived and 53.2% did not survive. 13 patients had CKD, out of which 15.4% survived and 84.6% did not survive. 96 patients presented within 7 days of onset of illness, out of which 61.5% survived and 38.5% did not survive. 58 patients received NIV support, out of which 15.5% survived and 84.5% did not survive.
Table 1. Descriptive Table
| Survivors | Nonsurvivors | |
| Males (96) | 53 (55.2%) | 43 (44.8%) |
| Females (24) | 14 (58.3%) | 10 (41.7%) |
| Hypertensives (62) | 29 (46.8%) | 33 (53.2%) |
| Non-hypertensives (58) | 38 (65.5%) | 20 (34.5%) |
| Diabetics (79) | 42 (53.2%) | 37 (46.8%) |
| Non-diabetics (41) | 25 (61%) | 16 (39%) |
| CAD (17) | 7 (41.2%) | 10 (58.8%) |
| NON-CAD (103) | 60 (58.3%) | 43 (41.7%) |
| CKD (13) | 2 (15.4%) | 11 (84.6%) |
| NON-CKD (107) | 65 (60.7%) | 42 (39.3%) |
| AGE <50 (31) | 22 (71.0%) | 9 (29.0%) |
| AGE>50 (89) | 45 (50.6%) | 44 (49.4%) |
Table 2. Association of age of patients with outcome.
| Age × Status | |||||||
| Age Range | Status | Total | % | P-Value | |||
| Alive | % | Death | % | ||||
| < 50 | 22 | 71.0% | 9 | 29.0% | 31 | 25.8% | χ2 = 0.049 SIG |
| > 50 | 45 | 50.6% | 44 | 49.4% | 89 | 74.2% | |
| Over All | 67 | 55.8% | 53 | 44.2% | 120 | ||
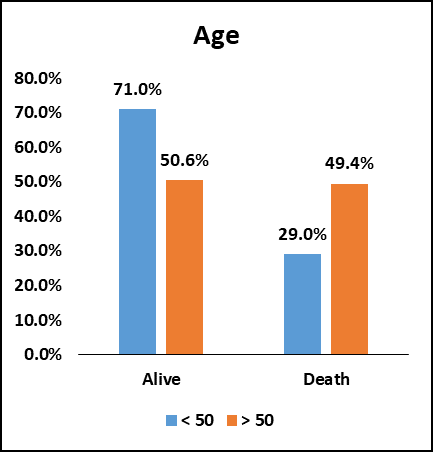
Fig. 1. Bar chart of Age in the study population.
Among the study population (120), 31 (25.8%) patients were below 50 years of age. 22 (71%) patients survived and 9 (29%) patients did not survive. 89 (74.2%) patients were above 50 years of age. 45 (50.6%) patients survived and 44 (49.4%) patients did not survive.
The chi-square value is 0.049. There was an association between increasing age and decreased chances of survival of patients and it was statistically significant.
Table 3. Association of gender of patients with outcome.
| Sex*Status | |||||||
| GENDER | Status | Total | % | P-Value | |||
| Alive | % | Death | % | ||||
| Male | 53 | 55.2% | 43 | 44.8% | 96 | 80.0% | χ2= 0.783 NS |
| Female | 14 | 58.3% | 10 | 41.7% | 24 | 20.0% | |
| Over All | 67 | 55.8% | 53 | 44.2% | 120 | ||
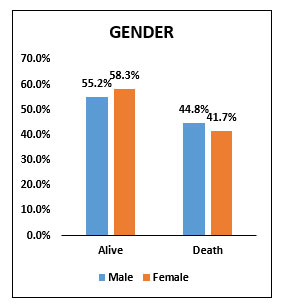
Fig. 2. Bar chart of gender in the study population.
Among the study population (120), 96 (80 %) were males of which 53 (55.2%) survived and 43 (44.8%) did not survive. 24 (20%) were females of which 14 (58.3%) patients survived and 10 (41.7%) patients did not survive. The chi-square value is 0.783 and there was no statistically significant association between gender of the patients and chances of survival in our study.
Table 4. Association of the BMI of the patients with outcome
| BMI × Status | |||||||
| BMI | Status | Total | % | P-Value | |||
| Alive | % | Death | % | ||||
| < 25 | 48 | 59.3% | 33 | 40.7% | 81 | 67.5% | χ2= 0.276 NS |
| > 25 | 19 | 48.7% | 20 | 51.3% | 39 | 32.5% | |
| Over All | 67 | 55.8% | 53 | 44.2% | 120 | ||
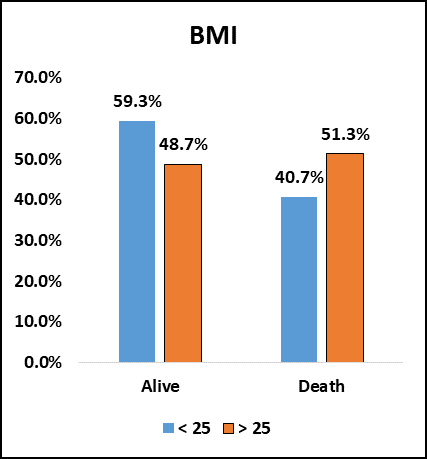
Fig. 3. Bar chart showing BMI in the study population.
Among the study population (120), 81 (67.5%) patients had BMI less than 25 of which 48 (59.3%) patients survived and 33 (40.7%) patients did not survive. 39 (32.5%) patients had BMI more than 25 of which 19(48.7%) patients survived and 20(51.3%) did not survive. The chi square value is 0.296. So, there was no statistically significant association between BMI of the patients and chances of survival in our study.
Table 5. Association of the hypertensive status of the patients with outcome
| Hypertension × Status | |||||||
| Hypertension | Status | Total | % | P-Value | |||
| Alive | % | Death | % | ||||
| Yes | 29 | 46.8% | 33 | 53.2% | 62 | 51.7% | χ2 = 0.039 SIG |
| No | 38 | 65.5% | 20 | 34.5% | 58 | 48.3% | |
| Over All | 67 | 55.8% | 53 | 44.2% | 120 | ||
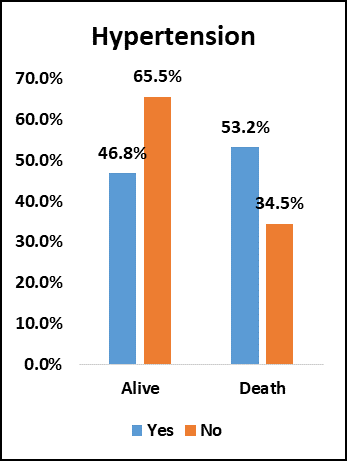
Fig. 4. Bar chart showing Hypertension in the study population.
Among the study population (120), 62 (51.7%) were hypertensive of which 29 (46.3%) patients survived and 33 (53.2%) patients did not survive. 58 (48.3%) were non-hypertensive of which 38 (65.5%) survived and 20 (34.5%) did not survive. The chi-square value is 0.039. There was an association between non-hypertensive status and increased chances of survival and was statistically significant.
Table 6. Association of Diabetes Mellitus of the patients with outcome
| Diabetes × Status | |||||||
| Diabetes | Status | Total | % | P-Value | |||
| Alive | % | Death | % | ||||
| Yes | 42 | 53.2% | 37 | 46.8% | 79 | 65.8% | χ2= 0.414 NS |
| No | 25 | 61.0% | 16 | 39.0% | 41 | 34.2% | |
| Over All | 67 | 55.8% | 53 | 44.2% | 120 | ||
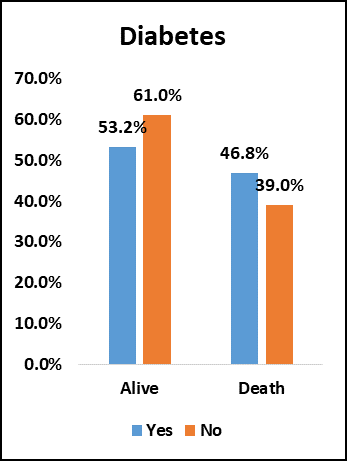
Fig. 5. Bar chart showing Diabetes Mellitus in the study population.
Among the study population (120), 79 (65.8%) were diabetic of which 42 (53.2%) survived and 37 (46.8%) did not survive.
41 (34.2%) patients were non-diabetic of which 25 (61%) patients survived and 16 (39%) patients did not survive. The chi-square value is 0.414 and there was no statistically significant association between diabetic status of the patients and chances of survival.
Table 7. Association between CAD status of the patients with outcome
| CAD × Status | |||||||
| CAD | Status | Total | % | P-Value | |||
| Alive | % | Death | % | ||||
| Yes | 7 | 41.2% | 10 | 58.8% | 17 | 14.2% | χ2 = 0.189 NS |
| No | 60 | 58.3% | 43 | 41.7% | 103 | 85.8% | |
| Over All | 67 | 55.8% | 53 | 44.2% | 120 | ||
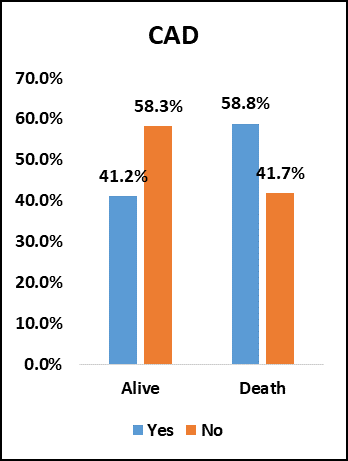
Fig. 6. Bar chart showing CAD in the study population.
Among the study population (120), 17 (14.2%) patients had CAD of which 7 (41.2%) patients survived and 10 (58.8%) did not survive.
103 (85.8%) patients had no CAD of which 60 (58.3%) patients survived and 43 (41.7%) did not survive. The chi-square value is 0.189 and there was no significant association between CAD status and chances of survival of the patients.
Table 8. Association between CKD status of the patients with outcome
| CKD × Status | |||||||
| CKD | Status | Total | % | P-Value | |||
| Alive | % | Death | % | ||||
| Yes | 2 | 15.4% | 11 | 84.6% | 13 | 10.8% | χ2= 0.002 SIG |
| No | 65 | 60.7% | 42 | 39.3% | 107 | 89.2% | |
| Over All | 67 | 55.8% | 53 | 44.2% | 120 | ||
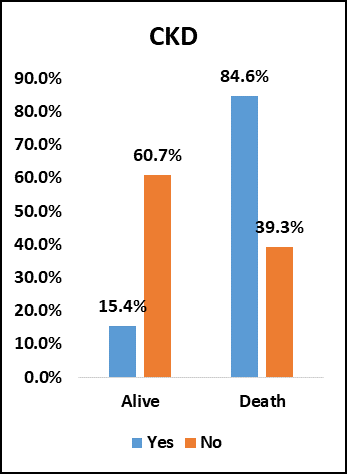
Fig. 7. Bar chart showing CKD in the study population.
Among the study population (120), 13 (10.8%) had CKD of which 2 (15.4%) patients survived and 11 (84.6%) did not survive.
107 (89.2%) patients had no CKD of which 65 (60.7%) survived and 42 (39.3%) did not survive. The chi-square value is 0.002. There was a statistically significant association between the non-CKD status of the patients and increased chances of survival.
Table 9. Association between number of comorbidities of the patients and outcome
DM, HTN, CAD and CKD were taken as comorbidities.
| No of comorbidity YES × Status | |||||||
| No of comorbidities | Status | Total | % | P-Value | |||
| Alive | % | Death | % | ||||
| 0 | 19 | 70.4% | 8 | 29.6% | 27 | 23% | χ2= 0.045 SIG |
| 1 | 23 | 63.9% | 13 | 36.1% | 36 | 30% | |
| 2 | 18 | 50.0% | 18 | 50.0% | 36 | 30% | |
| 3 | 7 | 33.3% | 14 | 66.7% | 21 | 18% | |
| Over All | 67 | 53 | 120 | ||||
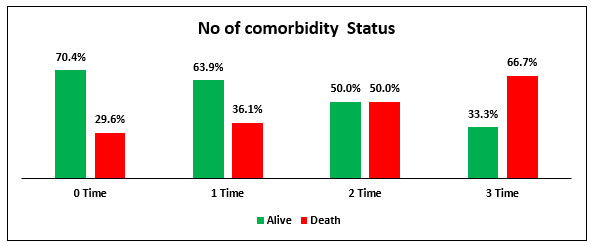
Fig. 8. Bar chart showing number of comorbidities in the study population.
Among the study population (120), 27 (23%) patients had no comorbidities of which 19 (70.4%) patients survived and 8 (29.6%) patients did not survive. 36 (30%) patients had 1 comorbidity of which 23 (63.9%) survived and 13 (36.1%) did not survive. 36 (30%) patients had 2 comorbidities of which 18 (50%) patients survived and 18 (50%) patients did not survive. 21 (18%) patients had 3 comorbidities of which 7 (33.3%) patients survived and 14 (66.7%) did not survive. The chi-square value is 0.045. There was a statistically significant association between increased number of comorbidities and decreased chances of survival.
Table 10. Association between day of illness at presentation and outcome
| DOI Present × Status | |||||||
| DOI Present | Status | Total | % | P-Value | |||
| Alive | % | Death | % | ||||
| Less than 7 Days DOI Present | 59 | 61.5% | 37 | 38.5% | 96 | 80% | χ2= 0.013 SIG |
| More than 7 Day than DOI Present | 8 | 33.3% | 16 | 66.7% | 24 | 20% | |
| Over All | 67 | 53 | 120 | ||||
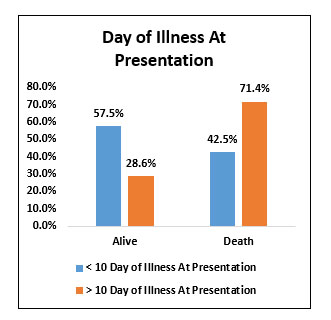
Fig. 9. Bar chart showing Day of illness at presentation.
Among the study population (120), 96 (80%) patients presented before 7th day of illness of which 59 (61.5%) patients survived and 37 (38.5%) did not survive. 24 (20%) patients presented after 7th day of illness of which 8 (33.3%) patients survived and 16 (66.7%) patients did not survive. The chi-square value is 0.013 and there was a statistically significant association between presenting to the hospital before 7th day of illness and increased chances of survival.
Table 11. Association between the status of treated in outside hospital initially and outcome
| Treated Outside and Transferred Here * Status | |||||||
| Treated Outside and Transferred Here | Status | Total | % | P-Value | |||
| Alive | % | Death | % | ||||
| Yes | 9 | 52.9% | 8 | 47.1% | 17 | 14.2% | χ2= 0.795 NS |
| No | 58 | 56.3% | 45 | 43.7% | 103 | 85.8% | |
| Over All | 67 | 55.8% | 53 | 44.2% | 120 | ||
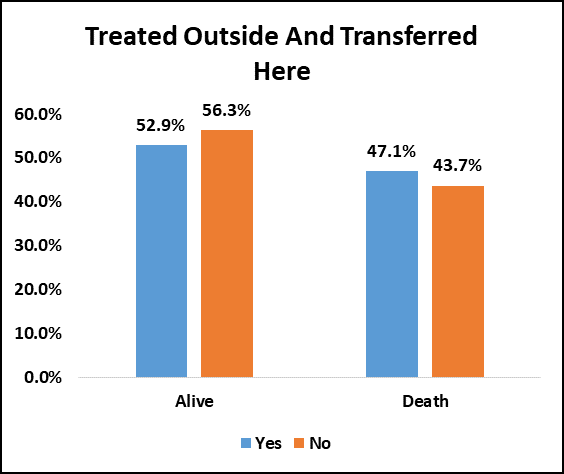
Fig. 10. Bar chart showing status of treated outside and transferred here.
Among the study population (120), 17(14.2%) patients were treated outside and transferred here of which 9 (52.9%) patients survived and 8 (47.1%) did not survive.
103 (85.8%) patients were treated here from beginning of which 58 (56.3%) patients survived and 45(43.7%) did not survive. The chi-square value is 0.795 and there was no significant association between the status of treated outside initially and chances of survival.
Table 12. Association between duration of hospital stay and outcome.
| Duration of Hospital Stay * Status | |||||||
| Duration Of Hospital Stay | Status | Total | % | P-Value | |||
| Alive | % | Death | % | ||||
| < 15 Duration of Hospital Stay | 55 | 60.4% | 36 | 39.6% | 91 | 75.8% | χ2= 0.072 NS |
| > 15 Duration of Hospital Stay | 12 | 41.4% | 17 | 58.6% | 29 | 24.2% | |
| Over All | 67 | 55.8% | 53 | 44.2% | 120 | ||
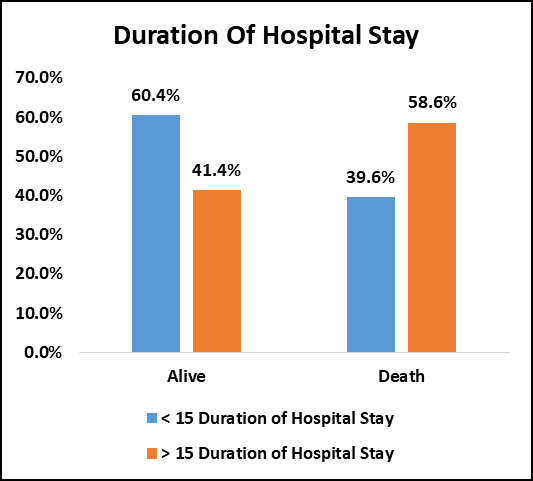
Fig 11. Bar chart showing status of duration of hospital stay.
Among the study population (120), 91 (75.8%) patients discharged before 15 days of hospital stay of which 55 (60.4%) patients survived and 36 (39.6%) did not survive.
29 (24.2%) patients discharged after 15 days of hospital stay of which 12 (41.4%) survived and 17 (58.6%) patients did not survive. The chi-square value is 0.072 and there was no significant association between duration of hospital stay and outcome.
Table 13. Association between treatment with remdesivir and outcome.
| Remdesivir * Status | |||||||
| Remdesivir | Status | Total | % | P-Value | |||
| Alive | % | Death | % | ||||
| Yes | 54 | 54.5% | 45 | 45.5% | 99 | 82.5% | χ2= 0.573 NS |
| No | 13 | 61.9% | 8 | 38.1% | 21 | 17.5% | |
| Over All | 67 | 1 | 53 | 0 | 120 | ||
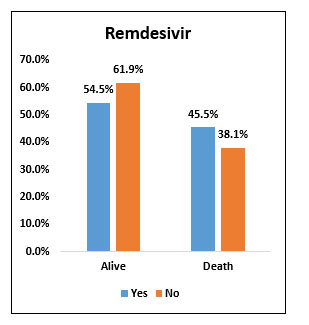
Fig. 12. Bar chart showing Remdesivir therapy status in the study population.
Among the study population (120), 99 (82.5%) received remdesivir of which 54 (54.5%) patients survived and 45 (45.5%) patients did not survive.
21 (17.5%) patients did not receive remdesivir of which 13 (61.9%) patients survived and 8 (38.1%) patients did not survive. The chi-square value is 0.573 and there was no statistically significant association between treatment with remdesivir and chances of survival.
Table 14. Association between use of convalescent plasma and outcome.
| Convalescent Plasma * Status | |||||||
| Convalescent Plasma | Status | Total | % | P-Value | |||
| Alive | % | Death | % | ||||
| Yes | 35 | 55.6% | 28 | 44.4% | 63 | 52.5% | χ2= 0.949 NS |
| No | 32 | 56.1% | 25 | 43.9% | 57 | 47.5% | |
| Over All | 67 | 1 | 53 | 0 | 120 | ||
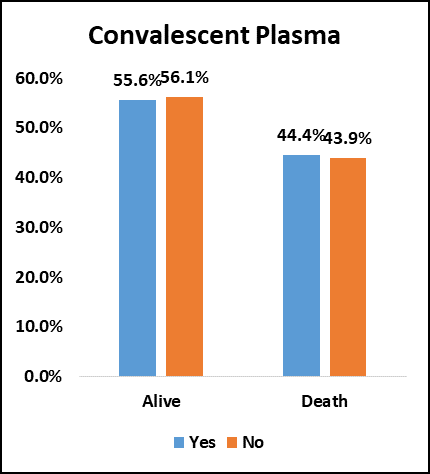
Fig. 13. Bar chart showing convalescent plasma therapy status in the study population.
Among the study population (120), 63 (52.5%) received convalescent plasma of which 35 (55.6%) patients survived and 28 (44.4%) did not survive.57 (47.5%) patients did not receive convalescent plasma of which 32 (56.1%) patients survived and 25 (43.9%) did not survive. The chi-square value is 0.949 and there was no significant association between use of convalescent plasma and increased chance of survival.
Table 14. Association between use of antibiotics and outcome.
| Antibiotics × Status | |||||||
| Antibiotics | Status | Total | % | P-Value | |||
| Alive | % | Death | % | ||||
| Yes | 61 | 54.0% | 52 | 46.0% | 113 | 94.2% | χ2= 0.101 NS |
| No | 6 | 85.7% | 1 | 14.3% | 7 | 5.8% | |
| Over All | 67 | 1 | 53 | 0 | 120 | ||
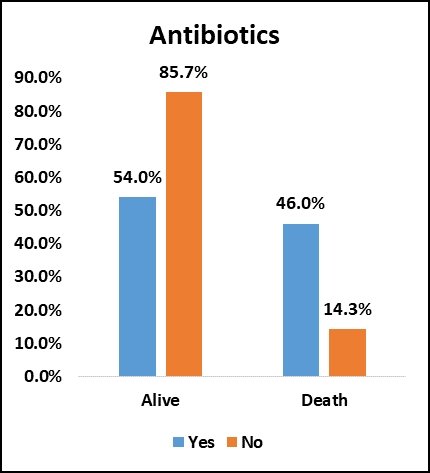
Fig. 13. Bar chart showing antibiotic therapy status in the study population.
Among the study population (120), 113 (94.2%) received antibiotics of which 61 (54%) survived and 52 (46%) did not survive. 7 (5.8%) patients did not receive antibiotics of which 6 (85.7%) survived and 1 (14.3%) did not survive. The chi-square value is 0.101 and there was no significant association between use of antibiotics and increased chance of survival.
Table 15. Association between use of NIV and outcome.
| NIV × Status | |||||||
| NIV | Status | Total | % | P-Value | |||
| Alive | % | Death | % | ||||
| Yes | 9 | 15.5% | 49 | 84.5% | 58 | 48.3% | χ2= 0.000 SIG |
| No | 58 | 93.5% | 4 | 6.5% | 62 | 51.7% | |
| Over All | 67 | 1 | 53 | 0 | 120 | ||
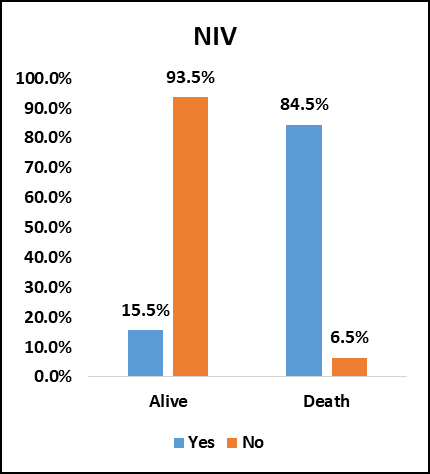
Fig 14. Bar chart showing NIV status in the study population.
Among the study population (120), 58(48.3%) received NIV support of which 9 (15.5%) survived and 49 (84.5%) did not survive. 62 (51.7%) did not receive NIV support of which 58 (93.5%) survived and 4 (6.5%) did not survive. The chi-square value is 0.000. There was significant association between not received NIV and increased chances of survival.
Table 16. Association between use of HFNO and outcome.
| HFNO × Status | |||||||
| HFNO | Status | Total | % | P-Value | |||
| Alive | % | Death | % | ||||
| Yes | 6 | 85.7% | 1 | 14.3% | 7 | 5.8% | χ2= 0.101 NS |
| No | 61 | 54.0% | 52 | 46.0% | 113 | 94.2% | |
| Over All | 67 | 1 | 53 | 0 | 120 | ||
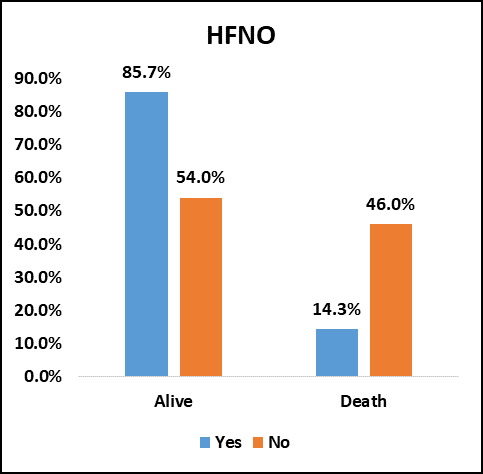
Fig. 15. Bar chart showing HFNO status in the study population.
Among the study population (120), 7 (5.8%) patients received HFNO support of which 6 (85.7%) survived and 1 (14.3%) did not survive.113 (94.2%) did not receive HFNO of which 61(54%) survived and 52 (46%) did not survive. The chi square value is 0.101 and there was no significant association between use of HFNO and chances of survival. Number of patients who received HFNO was very low due to oxygen shortage.
Discussion
Out of 120 patients, 89 patients (74.2%) and 31 patients (25.8%) were above 50 and below 50 years of age respectively and there was decreased chances of survival among the patients above 50 years of age. In a study conducted by Lingshuang Sheng et al in 2020, which studied 232 patients with COVID-19, which also showed the mean age of the critically ill patients to be older.
The lower limit of age was 25 and the upper limit of age was 70.
In our study, compared to males the number of females were much lower in the study group, 80% and 20% respectively. But there was no difference in outcome. In the study conducted by Jian-Min-Jin et al in2020, where they studied 1623 patients, they reported that men had poor outcome compared to women. The number of men who died from COVID-19 is 2.4 times more than that of women.
Out of 120 patients, majority of patients had BMI below 25 (67.5%). Only 32.5% had BMI above 25. In our study there was no statistically significant association between BMI of the patients and chances of survival. In a study conducted by Lyudmyla Kompaniyets et al in 2020 where they studied 71491 patients, approximately 1.8% of patients were underweight, 28.3% were overweight, and 50.8% were obese. Obesity was a risk factor for both hospitalization and death, exhibiting a dose response relation with increasing BMI category.
In our study, compared to hypertensives, non-hypertensives were less in the study group, 51.7% and 48.3% respectively, and there was a statistically significant association between the hypertensive status of the patients and increased mortality. This was similar to the study by Raymond Pranata et al which also revealed hypertension to be associated with increased composite poor outcome that consists of mortality, severe COVID-19, ARDS, need for ICU care and disease progression in patients with COVID-19.
Out of 120 patients, 65.8% and 34.8% were diabetic and non-diabetic respectively and there was no difference in outcome between these two groups in our study.
In our study, the number of CAD patients were less compared to non-CAD patients 14.2% and 85.8% respectively and there was no statistically significant difference in outcome between these two groups.
Out of 120 patients, 10.8% patients had CKD and 89.2% patients had no CKD. Among the CKD patents, 84.6% patients did not survive and there was a statistically significant association between CKD status and increased mortality. A similar study was done by Ruyi Cayi et al in 2020 which revealed CKD patients with COVID-19 had a high mortality risk.
In our study, the number of comorbidities of patients were studied which included DM, HTN, CAD and CKD. Out of 120 patients 23% had no comorbidities, 30% had 1 comorbidity, 30% had 2 comorbidities, 30% had 3 comorbidities and 18 % had 3 comorbidities and there is a statistically significant association between increased number of comorbidities and mortality. In a similar study conducted by Paddy Sentongo in 2020, they found that patients with COVID-19 with cardiovascular disease, hypertension, diabetes, congestive heart failure, CKD and cancer had greater risk of mortality compared to patients with COVID-19 without these comorbidities.
Out of 120 patients, 80% presented within 7 days of onset of illness and 20% presented after 7 days of onset of illness and there was a statistically significant association between presenting to the hospital within 7 days of onset of illness and decreased mortality probably due to early initiation of appropriate therapy.
In our study, 14.2% of the patients got admitted in our hospital after taking treatment from an outside hospital and transferred here. 85.8% of the patients directly presented to our hospital without any previous treatment. There was no significant difference in mortality between these two groups.
Out of 120 patients, for majority of the patients (75.2%) the duration of hospital stay was less than 15 days. Only 24.2% patients had duration of hospital stay more than 15 days. There was no significant difference in mortality between these two groups. In an ambispective cohort study conducted by Kewang et al, 548 patients were studied. 14.2% patients of this cohort reached the primary end point of death within 15 days hospitalization. Aging, hypoxia, lymphopenia, high LDH level and multiple organ dysfunction were associated with increased 15 day in hospital mortality from COVID-19.
In our study, 82.5% of the patients received remdesivir and 17.5% did not receive remdesivir. There was no significant difference in mortality between these two groups. In a study conducted by Vikas Bansal in 2021,1895 patients were studied. The result of contemporary meta-analysis suggested that mortality benefits with remdesivir in COVID-19 and median recovery time was over 2 weeks. The pooled mortality with remdesivir was found to be low.
In our study, 52.5% of the patients received convalescent plasma during hospital stay. There was no significant difference in mortality between the groups who received plasma and those who did not receive plasma. Micheal J Joyner et al studied 35322 patients who received convalescent plasma. The study showed there was a relationship between reduced mortality and both earlier time to transfusion and higher antibody levels for convalescent plasma in the treatment of hospitalized COVID-19 patients.
Out of 120 patients, 94.2% patients received antibiotics. Only 5.8% patients did not receive antibiotics. There was no significant association between use of antibiotics and mortality. In a similar study conducted by Andreea Rosca et al. they studied 101 patients who received antibiotics and 48 patients who did not receive antibiotics. The study revealed that overall mortality was higher for the group that received antibiotics than the other group.
In our study, 48.3% received NIV support and 51.7% did not receive NIV support. There was a statistically significant difference in mortality between these two groups. Mortality was more in group who received NIV support. In a study conducted by Dejan Radovanovic et al 635 people were studied who were treated with CPAP/ NIV. They concluded that CPAP and NIV appear to be equally and frequently applied in patients with COVID-19 pneumonia, but associated with high mortality. Those who received NIV were sicker and more hypoxic and had severe disease.
In our study, majority of the patients (94.2%) did not receive HFNO support. Only 5.8% received HFNO support and there was no significant association between use of HFNO and mortality.
In our study only 5.8% of patients were given HFNO due to oxygen shortages and therefore we could not obtain a reasonable conclusion from analysis.
Summary and Conclusions
Our observations were
- Majority of the patients were above 50 years of age and there was decreased chances of survival among patients who were above 50 years of age.
- Most of the patients who presented with moderate and severe COVID-19 were males (80%).
- Compared to hypertensives, non-hypertensives were less affected with moderate and severe COVID-19
- There was an association between the hypertensive status of the patients and increased mortality.
- Majority of the patients presented with moderate and severe COVID-19 were diabetic (65.8%).
- The mortality in CKD patients were more compared to non-CKD patients.
- There was a statistically significant association between increased number of comorbidities in patients with moderate and severe COVID-19 and decreased chances of survival. ( Diabetes, hypertension, CAD, CKD )
- The mortality was less in patients who presented to the hospital within 7 days of onset of illness.
- The mortality was more in patients who received NIV support.
- Treatments like Remdesivir, Antibiotics and Convalescent plasma did not influence the outcome.
In conclusion, patients with multiple comorbidities were more likely to develop severe COVID with a higher mortality risk. Males were more at risk than females. Therefore patients with multiple comorbidities especially males require early attention and treatment if they develop COVID-19.
Limitations
Limitations of our study include the limited number of patients studied, disparity in numbers in subgroup analysis and being a retrospective study exact time of remdesivir and convalescent plasma administration in the stage of illness was not known which could have influenced outcome.
Reference
- Rothe C, et al. Transmission of 2019-nCoV Infection from an Asymptomatic Contact in Germany. N Engl J Med. 2020;382(10):970-1.
- Phan LT, et al. Importation and Human-to Human Transmission of a Novel Coronavirus in Vietnam. N Engl J Med. 2020;382(10):872-4
- Yuan S, et al. A familial cluster of pneumonia associated with the 2019 novel coronavirus indicating person-to-person transmission: a study of a family cluster. Lancet. 2020;395(10223):514-23.
- Smyk W, et al. COVID-19: focus on the lungs but do not forget the gastrointestinal tract. Eur J Clin Invest. 2020;50:132-76.
- Portincasa P, et al. Hepatic consequences of COVID-19 infection. Lapping or biting? Eur J Intern Med. 2020;77:18-24.
- Du Y, et al. Clinical features of 85 fatal cases of COVID-19 from Wuhan: a retrospective observational study. Am J Respir Crit Care Med. 2020; 201:1372-9.
- Zhang J, et al. Risk factors for disease severity, and mortality of COVID-19 patients in Wuhan, China. Clin Microbiol Infect. 2020;26:767-72.
- Yu C, et al. Clinical characteristics, associated, and predicting COVID-19 mortality risk: A retrospective study in Wuhan, China. Am J Prevent Med. 2020;59:168-75.