Efficacy of individualized use of a multisensory integrative environment on engagement: In children with sensory modulation disorder
M. Mahendran*
Paediatric Occupational Therapist, unit of Hamsa, Kauvery Hospital, Trichy, India
*Correspondence: Maherichy987@Gmail.Com
Abstract
Aim: To find the effect of multisensory therapy based paediatric Occupational Therapy strategies on children with sensory modulation disorder.
Objectives
- To screen sensory modulation disorder (SMD) children by using SMD diagnostic sensory profile-2 scale.
- To assess sensory under response (SOR), sensory over response (SOR) and sensory craving (SC) of SMD children.
- To compare the sensory and behavioural section between control and experimental participation groups.
Methodology: Totally 30 subjects (15 in experimental group and 15 in control group) of age group of 2 years to 35 months participated in current study.
Results: Significant reduction in social sensory modulation quadrants, with regard to multi-sensory therapy in occupational therapy.
Conclusion: participation in multisensory therapy has significant effect in reducing sensory issues and maladaptive behavioural problems in SMD pupil.
Keywords: Multisensory therapy, Sensory modulation disorder, Paediatric Occupational Therapy, sensory profile.
Background
Multi-Sensory stimulation is used in all stages of expansion, from infants to the elderly. They benefit people with cognitive impairments and developmental disabilities resulting from Autism, Cerebral Palsy, Profound Multiple Disabilities, Developmental Disabilities, Chronic Pain Syndrome, ADHD, SPD (Sensory processing Disorder), Pervasive Developmental Delays, Traumatic Brain Injury, Stroke, Coma, Alzheimers and Dementia Multi-Sensory Environments.
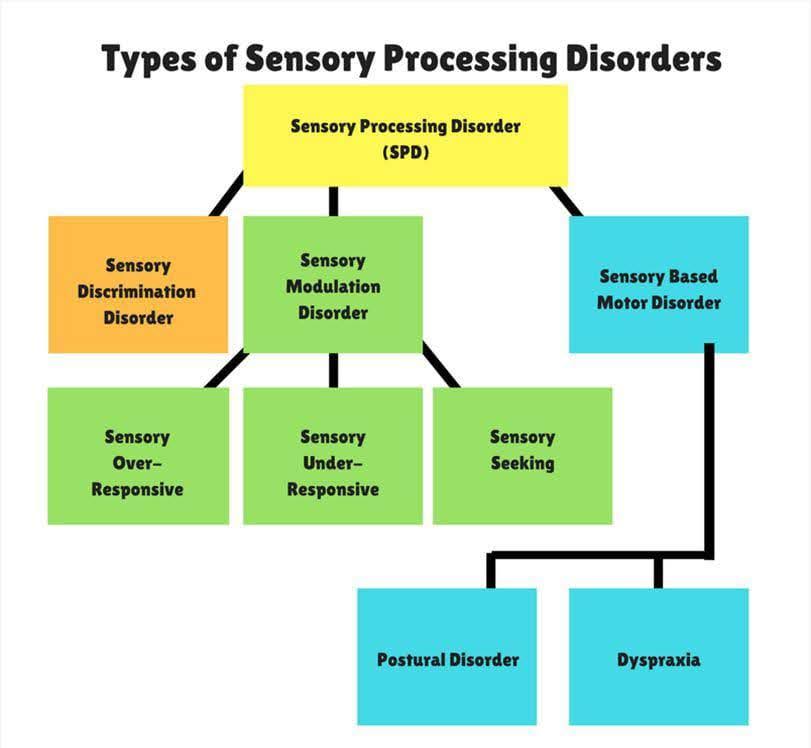
Patients with traumatic brain injury and those with ontological impairments also benefit, as do agitated patients and those in need of pain management. The environment in which the sensory stimuli are given is significant in the therapeutic progression (Slavik and Chew, 1990; Walker, 1991). Millers sensory integration dysfunction was renamed into Sensory processing disorder to integrate the work with other fields such as neuroscience. The use of the term sensory integration often applies to a neurophysiologic cellular process rather than a behavioural response to sensory input as connoted by Ayres. Sensory modulation refers to a multifarious central nervous system process by which neural communication that convey information about the concentration, occurrence extent, intricacy, and novelty of sensory stimuli are adjusted consists of three subtypes: Sensory over-responsivity, Sensory under-responsivity and Sensory craving/seeking. Ayres developed her sensory integration therapy in a sensory room with specific characteristics, included the presence of an Paediatric occupational therapist or occupational therapy professional, in a calm and safe environment, and occupational formats that provided significant sensory opportunities utilizing a diversity of modalities to engage the senses (Ayres, 1971; Ayres 1979 as cited in Parham et al., 2007), such as suspension apparatus, therapy balls, ramps, and mountaineering structures.
In contemporary practice, therapeutic interventions often take place in enthusiastic spaces called Multisensory Environments (MSEs).
Primary Pattern |
Subtype |
Description |
| Sensory Modulation Disorder | Difficulty regulating responses to sensory | Sensory graving /seeking |
| Sensory over response (SOR) | Sensory Over-Responsive | Predisposition to respond too much |
| Sensory under response (SOR) | Sensory Under-Responsive | Predisposition to be unaware of sensory |
Aim: To find the efficacy of individualized use of a multisensory integrative environment on engagement in children with sensory modulation disorder.
Objectives
- To screen SMD children by using sensory profile-2 scale.
- To assess sensory processing skills of SMD children.
- To assess sensory under or over processing and also seeking skills of SMD children.
Methodology
Study Design: The study is done with two group of pre-test and post-test of quasi experimental design (Pre-Post Experimental Study). Experimental group = pre-test (multisensory therapy+ interaction) post-test Control group = pre-test (interaction) post-test.
Sample Size: Total numbers of following samples of 30 subjects have engaged in this study. The subjects were divided into two groups as experimental and control group. The control group consist of 15 subjects, and experimental group consist of 15 subjects.
Sampling Technique: Simple Random sampling technique was adopted.
Study Place: Department of Occupational therapy, Unit of Hamsa rehab for kids, Kauvery hospital, Trichy-620 001.
Duration of Study: Duration of the study is 3 months (June 2023 to Sep-2023).
Selection Criteria: Inclusion Criteria; Participants were children with SMD between age 1year to 2.11 years, Children with Sensory modulation problems, both males and females included the study.
Exclusion Criteria: Age should not be more than 3 years or less than 1 year, Children with neurologic problems, Retts, Asperger syndrome, MD, ADHD and other associated conditions are excluded this study.
Variables of the study: Independent variables-multi sensory therapy, dependant variables sensory issues of SMD.
Hypothesis – Null Hypothesis: There are no significant the effect of occupational therapy spatial play-based management on cooperative behaviour in elementary school-aged children with an autism spectrum disorder.
Alternative Hypothesis: There is significant the effect of occupational therapy spatial play-based management on cooperative behaviour in elementary school-aged children with an autism spectrum disorder.
Measurement Tools/Material Required
The tool used for the study is Toddler sensory profile-2 on sensory processing skills. Measured with SMD.
Procedure: subjects attended six sessions per weekly (one introductory session and five MSIE sessions). Sessions were scheduled at the expediency of parents and were completed in three-month duration. Sessions were conducted at around the 45 min per day in an effort to control for individual differences across time of day. In the first session, the research personnel obtained informed consent from the parents and consent from the subjects. The child participant and parent were oriented to the study procedure (including whats app procedure to schedule sessions and to arrive with their child rested, fed, and toileted or changed, as appropriate). The parents completed the demographics questionnaire and the Toddler Sensory Profile-2 (Winnie Dunn) while the research personnel conducted the SMD Diagnostic Scale (SP-2) with the child participant in an adjacent room. The toddler SP-2 assessment was videotaped using a Panasonic high-definition video recorder with audio capabilities for later offline analysis. A stuffed bear named Lucy was used to demonstrate donning and doffing of the devices during the first session. Upon arrival for the six subsequent MSIE sessions (Activity configurational approach protocol-driven condition and three in the individualized condition), the parents were asked to assist the research personnel in applying the physiological measurement devices when needed. Child participants remained seated on a child-sized chair next to the door while the physiological measurement devices were prepared to activate and stream/record. The kids participant was then led to the MSIE to engage in a 45 min session. Parents had the option to inconspicuously observe the sessions via the two wall-mounted cameras or to accompany the child. Research personnel remained with the participants in the MSIE to ensure their safety and take field notes. Research personnel only interacted with the kids if the participant initiated the interaction. When participants engaged in behaviours that were unsafe or destructive, research personnel redirected them. If unsafe or destructive behaviours persisted after three attempts to redirect, the parent was asked to intervene. If the parent intervention was unsuccessful, the session was terminated. After completion of all MSIE sessions, parents were asked to observe videotaped sessions and count incidents of desired and undesired behaviours (as they defined them). Parents were also asked to complete a reflective questionnaire about their kids experience in the MSIE.
Data Analysis and Results
Statistical Analysis: This study used two groups of populations were collected the data of pre- and post-intervention toddler sensory profile elevation. The entire statistical test was performed using statistical package for graph pad instate software version 3.1 respectively.
Table 1: Characteristic of data pre-Control group and pre-experimental group pre-evaluation -Toddler Sensory profile-2
Characteristic of data-Unpaired t-test |
Control group pre-test evaluation (SP-2) |
Experimental group pre-test evaluation (SP-2) |
| Mean | 106.00 | 121.80 |
| Standard Deviation | 29.09 | 51.06 |
| Sample size | 15 | 15 |
| standard error (SE) means | 13.01 | 22.84 |
| 95% confidence interval difference | 76.40 | 44.80 |
Table 1; Data shows pre-control-pre-experimental group (SP-2) pre-test evaluation scores of all 30 subjects, mean values are 106.00 and 121.80, respectively standard deviation 29.09 and 51.06 respectively sample size 30, standard error of mean 13.01 and 22.84, the mean of pre control and experimental 95% confidence interval of this difference 76.40 and 44.80, respectively.
Table 2: Unpaired test results between pre- control and experimental groups of The Sensory profile-2 (SP-2) evaluation
S.No. |
Variable 1 |
Variable 2 |
p- Value |
t-Value |
Level of Significance |
| 1 | Pre experimental group | Post experimental group | 0.05643 | 0.06012 | Not statistically Significant |
Table 2; This shows that comparison between the pre-experimental and pre- control group of The Sensory profile-2 (SP-2) in pre-evaluation test scores of all 30 subjects, t value is 0.6012 p-value is 0.05643 This difference is considered to be statistically significant.
Graph 1: Mean of Pre-control- pre-experimental groups of evaluation -The Sensory profile-2

Table 3: Characteristic of data experimental group pre- post evaluation -Toddler Sensory profile-2 (sensitivity and sensor)
Characteristic of data-Unpaired t-test |
Experimental group pre-test evaluation (SP-2) |
Experimental group post-test evaluation (SP-2) |
| Mean | 61.53 | 29.67 |
| Standard Deviation | 13.43 | 15.77 |
| Sample size | 15 | 15 |
| standard error (SE) means | 3.47 | 4.07 |
| 95% confidence interval difference | 20.91 | 42.82 |
Table 3; Data shows pre-post experimental group (SP-2) pre-test evaluation scores of all 30 subjects, mean values are 61.53 and 29.67, respectively standard deviation 13.43 and 15.77 respectively sample size 30, standard error of mean 3.47 and 4.07, the mean of pre control and experimental 95% confidence interval of this difference 20.91and 42.82, respectively.
Table 4: Unpaired test results between pre- post experimental groups of The Sensory profile-2 (SP-2) (sensitivity and sensor) evaluation
S.No. |
Variable 1 |
Variable 2 |
p-Value |
t-Value |
Level of Significance |
| 1 | Pre experimental group | Post experimental group | 0.0001 | 5.9582 | Statistically Significant |
Table 4; This shows that comparison between the pre-experimental and control group of The Sensory profile-2 (SP-2) in pre-evaluation test scores of all 30 subjects, t value is 0.0001 p-value is 5.9582 This difference is considered to be statistically significant.
Graph 2: Mean of Pre- post-experimental groups of evaluation -The Sensory profile-2(sensitivity and sensor SP-2).

Table 5: Characteristic of data experimental group pre- post evaluation -Toddler Sensory profile-2 (Registration by stander).
Characteristic of data-Unpaired t-test |
Experimental group pre-test evaluation (SP-2) |
Experimental group post-test evaluation (SP-2) |
| Mean | 46.07 | 15.40 |
| Standard Deviation | 11.34 | 11.61 |
| Sample size | 15 | 15 |
| standard error (SE) means | 2.93 | 3.00 |
| 95% confidence interval difference | 22.08 | 39.45 |
Table 5; Data shows pre-post experimental group (SP-2) pre-test evaluation scores of all 30 subjects, mean values are 46.07 and 15.40, respectively standard deviation 11.34 and 11.61 respectively sample size 30, standard error of mean 3.47 and 4.07, the mean of pre control and experimental 95% confidence interval of this difference 22.08 and 39.25, respectively.
Table 6: Unpaired test results between pre- post experimental groups of The Sensory profile-2 (SP-2) (sensitivity and sensor) evaluation.
S.No. |
Variable1 |
Variable 2 |
p-Value |
t Value |
Level of. Significance |
| 1 | Pre experimental group | Post experimental group | 0.0001 | 7.3193 | Statistically Significant |
Table 6; This shows that comparison between the pre-experimental and control group of The Sensory profile-2 (SP-2) in pre-evaluation test scores of all 30 subjects, t value is 0.0001 p-value is 7.3193 This difference is considered to be statistically significant.
Graph 3: Mean of Pre- post-experimental groups of evaluation-The Sensory profile-2(Registration by stander SP-2).

Table 7: Characteristic of data experimental group pre- post evaluation -Toddler Sensory profile-2 (Seeking/seeker).
Characteristic of data-Unpaired t-test |
Experimental group pre-test evaluation (SP-2) |
Experimental group post-test evaluation (SP-2) |
| Mean | 30.20 | 15.27 |
| Standard Deviation | 5.85 | 4.68 |
| Sample size | 15 | 15 |
| standard error (SE) means | 1.51 | 1.21 |
| 95% confidence interval difference | 10.97 | 18.89 |
Table 7; Data shows pre-post experimental group (SP-2) pre-test evaluation scores of all 30 subjects, mean values are 30.20 and 15.27, respectively standard deviation 5.85 and 4.68 respectively sample size 15, standard error of mean 1.51 and 1.21, the mean of pre control and experimental 95% confidence interval of this difference 10.97 and 18.89, respectively.
Table 8: Unpaired test results between pre- post experimental groups of The Sensory profile-2 (SP-2) (Seeking/seeker) evaluation
S.No. |
Variable.1 |
Variable. 2 |
p-Value |
t-Value |
Level of Significance |
| 1 | Pre experimental group | Post experimental group | 0.0001 | 7.7222 | Statistically Significant |
Table 8; This shows that comparison between the pre-experimental and control group of The Sensory profile-2 (SP-2) in pre-evaluation test scores of all 30 subjects, t value is 7.7222 p-value is 0.0001. This difference is considered to be statistically significant.
Graph 4: Mean of Pre- post-experimental groups of evaluation-The Sensory profile-2 Seeking/seeker

Table 9: Characteristic of data experimental group pre- post evaluation -Toddler Sensory profile-2 (Avoiding/avoider)
Characteristic of data-Unpaired t-test |
Experimental group pre-test evaluation (SP-2) |
Experimental group post-test evaluation (SP-2) |
| Mean | 52.80 | 19.80 |
| Standard Deviation | 6.17 | 10,35 |
| Sample size | 15 | 15 |
| standard error (SE) means | 1.59 | 2.67 |
| 95% confidence interval difference | 20.03 | 39.37 |
Table 9; Data shows pre-post experimental group (SP-2) pre-test evaluation scores of all 30 subjects, mean values are 52.80 and 19.80, respectively standard deviation 6.17 and 10.35 respectively sample size 15, standard error of mean 1.59 and 2.67, the mean of pre control and experimental 95% confidence interval of this difference 20.03and 39.37, respectively.
Table 10: Unpaired test results between pre- post experimental groups of The Sensory profile-2 (SP-2) (Seeking/seeker) evaluation
S.No. |
Variable 1 |
Variable 2 |
p-Value |
t-Value |
Level of Significance |
| 1 | Pre experimental group | Post experimental group | 0.0001 | 10.6066 | Statistically Significant |
Table 10; This shows that comparison between the pre-experimental and control group of The Sensory profile-2 (SP-2) in pre-evaluation test scores of all 30 subjects, t value is 10.6066 p-value is 0.0001 This difference is considered to be statistically significant.
Graph 5: Mean of Pre- post-experimental groups of evaluation-The Sensory profile-2 Avoiding/avoider

Table 11: Characteristic of data post-Control group and post-experimental group post-evaluation -Toddler Sensory profile-2
Characteristic of data-Unpaired t-test |
Experimental group Post control (sp2) |
Experimental group post-test evaluation(sp2) |
| Mean | 106.00 | 66.80 |
| Standard Deviation | 29.09 | 28.62 |
| Sample size | 15 | 15 |
| Standard Error (SE) means | 13.01 | 12.80 |
| 95% confidence interval difference | -2.88 | 81.28 |
Table 11; Data shows post-control-post-experimental group (SP-2) pre-test evaluation scores of all 30 subjects, mean values are 106.00 and 66.80, respectively standard deviation 29.09 and 28.62 respectively sample size 15, standard error of mean 13.01 and 12.80, the mean of pre control and experimental 95% confidence interval of this difference -2.88 and 81.28, respectively.
Table 12: Unpaired test results between post control and experimental groups of the Sensory profile-2 (SP-2) (sensitivity and sensor) evaluation
S.No. |
Variable 1 |
Variable 2 |
p-Value |
t-Value |
Level of Significance |
| 1 | Post control group | Post experimental group | 0.0640 | 2.1480 | quite statistically Significant |
Table 12; This shows that comparison between the experimental and control group of The Sensory profile-2 (SP-2) in post-evaluation test scores of all 30 subjects, value is 0.0640 p-value is 2.1480 This difference is considered to be statistically significant.
Graph 6: Mean of Post control and post-experimental groups of evaluation-The Sensory profile-2 Avoiding/avoider.

Discussion
- The purpose of the study is to determine the effect of multisensory therapy based paediatric Occupational Therapy strategies on Children with sensory modulation disorder. The evaluation tool for children with Toddler sensory profile-2 scale is the pre-test and post-test measurement tool. This scale is used to evaluate the level of sensory issues among 7 month-2.11 years childrens. Initially, sensory issues children were selected based on the inclusion criteria were assessed using the evaluation tool for children with sensory to get the pre-test values, multisensory approach-based occupational therapy sessions were scheduled and administered for 3 months one week. 7 sessions per week on alternative days each session lasted for1 an hour after the treatment sessions the post-test values were collected and tabulated.
- The effect of multisensory therapy based paediatric Occupational Therapy strategies-based Therapy Intervention for handwriting fine motor difficulties group Shows that the
- Table 1,2; data shows pre-control-pre-experimental group (SP-2) pre-test evaluation scores of all 30 subjects, mean values are 106.00 and 121.80, respectively standard deviation 29.09 and 51.06 respectively sample size 30, standard error of mean 13.01 and 22.84, the mean of pre control and experimental 95% confidence interval of this difference 76.40 and 44.80, respectively. These results supported article by Bar-Shalita T, Granovsky Y, Parush S, Weissman-Fogel I. Sensory Modulation Disorder (SMD) Ummugulsum Gundogdu, Ahmet Aksoy and Mehtap Eroglu. (2023) Sensory profiles, behavioral problems, and auditory findings in children with autism spectrum disorder.
- Table 3,4; data shows pre-post experimental group (SP-2) pre-test evaluation scores of all 30 subjects, mean values are 61.53 and 29.67, respectively standard deviation 13.43 and 15.77 respectively sample size 30, standard error of mean 3.47 and 4.07, the mean of pre control and experimental 95% confidence interval of this difference 20.91and 42.82, respectively.
- Table 5,6; data shows pre-post experimental group (SP-2) pre-test evaluation scores of all 30 subjects, mean values are 46.07 and 15.40, respectively standard deviation 11.34 and 11.61 respectively sample size 30, standard error of mean 3.47 and 4.07, the mean of pre control and experimental 95% confidence interval of this difference 22.08 and 39.25, respectively. The study supported results Miller LJ, Schoen SA, Mulligan S, Sullivan J Identification of Sensory Processing and Integration Symptom Clusters: A Preliminary Study. Occup
- Table 7,8; data shows pre-post experimental group (SP-2) pre-test evaluation scores of all 30 subjects, mean values are 30.20 and 15.27, respectively standard deviation 5.85 and 4.68 respectively sample size 15, standard error of mean 1.51 and 1.21, the mean of pre control and experimental 95% confidence interval of this difference 10.97 and 18.89, respectively.
- Table 9,10; data shows pre-post experimental group (SP-2) pre-test evaluation scores of all 30 subjects, mean values are 52.80 and 19.80, respectively standard deviation 6.17 and 10.35 respectively sample size 15, standard error of mean 1.59 and 2.67, the mean of pre control and experimental 95% confidence interval of this difference 20.03and 39.37, respectively. This article supported by results Miller LJ, Coll JR, Schoen SA. A randomized controlled pilot study of the effectiveness of occupational therapy for children with sensory modulation disorder.
- Table 11,12; data shows post-control-post-experimental group (SP-2) pre-test evaluation scores of all 30 subjects, mean values are 106.00 and 66.80, respectively standard deviation 29.09 and 28.62 respectively sample size 15, standard error of mean 13.01 and 12.80, the mean of pre control and experimental 95% confidence interval of this difference -2.88 and 81.28, respectively .This results supported by MacLean J, Finkelstein SA, Paredes-Echeverri S, Perez DL, Ranford J. Sensory Processing Difficulties in Patients with Functional Neurological Disorder: Occupational Therapy Management Strategies and Two Cases.
Conclusion
Multisensory therapy based paediatric Occupational Therapy strategies on Children with sensory modulation disorder and its role in enhancing participation and sensory activities skills and also to facilitate childrens multisensory performance and sensory integration day to day life meaningfully. The multisensory Approach focuses the childs goal setting and decision making, thereby enhancing motivation and promoting active commitment to recovery. Task analysis includes understanding of the nature task, Internal and external factors contexts that both facilitate and adaptive performance.
Reference
- MacLean J, Finkelstein SA, Paredes-Echeverri S, Perez DL, Ranford J. Sensory Processing Difficulties in Patients with Functional Neurological Disorder: Occupational Therapy Management Strategies and Two Cases. Semin Paediatric Neurol. 2022; 41:100951.
- Miller LJ, Coll JR, Schoen SA. A randomized controlled pilot study of the effectiveness of occupational therapy for children with sensory modulation disorder. Am J Occup Ther. 2007;61(2):228-38.
- Miller LJ, Schoen SA, Mulligan S, Sullivan J. Identification of Sensory Processing and Integration Symptom Clusters: A Preliminary Study. Occup Ther Int. 2017;2017:2876080.
- Bar-Shalita T, Granovsky Y, Parush S, Weissman-Fogel I. Sensory Modulation Disorder (SMD) and Pain: A New Perspective. Front Integr Neurosci. 2019;13:27.
- Ummugulsum Gundogdu, Ahmet Aksoy and Mehtap Eroglu. (2023) Sensory profiles, behavioral problems, and auditory findings in children with autism spectrum disorder. International Journal of Developmental Disabilities 69:3, pages 442-451.
- Ctia Couo Lucas, Ana Paula da Silva Pereira, Leandro da Silva Almeida and Isabelle Beaudry-Bellefeuille. (2022) Content Validity and Preliminary Structural Validity of the Sensory Integration Infant Routines Questionnaire. Journal of Occupational Therapy, Schools, & Early Intervention 0:0, pages 1-16.
- Adrin Galiana, Jose Maria Flores-Ripoll, Pedro Javier Benito-Castellanos, Clara Villar-Rodriguez & Maria Vela-Romero. (2022) Prevalence and severity-based classification of sensory processing issues. An exploratory study with neuropsychological implications. Applied Neuropsychology: Child 11:4, pages 850-862.
- M. Gonalves & A. M. Abreu. (2022) Sensory Processing and Occupational Participation. Journal of Occupational Therapy, Schools, and Early Intervention 0:0, pages 1-16.

Dr. M. Mahendran,
Paediatric Occupational Therapist.